Download

1 / 22
220 likes | 390 Vues
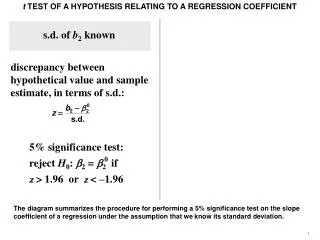
H 0 : H 1 : α = Decision Rule: If then do not reject H 0 , otherwise reject H 0 . Test Statistic: Decision: Conclusion: We have found ________________ evidence at the _____ level of significance that. H 0 : H 1 : α = Decision Rule: If

E N D
H0: H1: α = Decision Rule: If then do not reject H0, otherwise reject H0. Test Statistic: Decision: Conclusion: We have found ________________ evidence at the _____ level of significance that
H0: H1: α = Decision Rule: If then do not reject H0, otherwise reject H0. Test Statistic: Decision: Conclusion: We have found ________________ evidence at the _____ level of significance that .10 .10
Data are Normal (μ = 72, σ = 8). Data are not Normal (μ = 72, σ = 8). Goodness-of-fit test H0: H1: α = Decision Rule: If then do not reject H0, otherwise reject H0. Test Statistic: Decision: Conclusion: We have found ________________ evidence at the _____ level of significance that aptitude test scores are not normal (μ = 72, σ = 8). .10 .10
* means coverage is different from text. 2 Groups and > 2 Groups Flowchart 3 4 6 5 7 8 9 10 11 12 13 14 15 paired-difference t-test pp. 315-322 Spearman Rank Correlation test pp. 625-630 yes 1 yes yes Normal populations ? Wilcoxon Signed-Ranks *pp. 614-616 chi-square goodness-of-fit test pp. for the Multinomial Experiment 362-368 and the Normal Distribution 374-376 at least interval level data ? no no 2 Sign Test *pp. 631-634. mean or median yes Z for means with σ1 & σ2 pp. 307-315 yes n1> 30 and n2> 30 ? Related Samples ? yes Normal populations ? Jaggia and Kelly (1stedition) no no Wilcoxon Rank Sum *pp. 616-621 no no σ1 and σ2 both known ? n1> 30 and n2> 30 ? no yes pooled-variances t-test pp. 307-315 yes Normal populations ? no yes σ1 = σ2 ? no unequal-variances t-test p. 307-315 proportion 2 Z for proportions pp. 322-328 Parameter ? variance or standard deviation yes # of groups ? F = S12/S22 pp. 344-354 Normal populations ? no Levine-Brown-Forsythe mean or median yes 1-way ANOVA pp. 386-395 ANOVA OK ? no Kruskal-Wallis *pp. 621-625 more than 2 chi-square df = (R-1)(C-1) pp. 368-374 yes Can we make all fe> 5 ? proportion Parameter ? no Resample and try again. variance or standard deviation yes Hartley’s Fmax *(not in text) Normal populations ? no Default case Levine-Brown-Forsythe
Data are Normal (μ = 72, σ = 8). Data are not Normal(μ = 72, σ = 8). Goodness-of-fit test H0: H1: α = Decision Rule: If then do not reject H0, otherwise reject H0. Test Statistic: If all fe> 5, then one may use: Decision: Conclusion: We have found ________________ evidence at the _____ level of significance that aptitude test scores are not normal (μ = 72, σ = 8). .10 .10
For a chi-square goodness-of-fit test, fe is the frequency you would expect in the class if the null hypothesis is true. fe = (n)[P(in that class | H0 is true)]. For this problem H0 is: Data are Normal (μ = 72, σ = 8), so for this problem we will use Normal probabilities. To get Normal probabilities, we must first calculate the appropriate Z values using the formula: and look up the probabilities in the Z table.
Let X = an aptitude test score. We are assuming that X is Normal, so we can find probabilities about X by using the Z Table. What is P(50 £ X < 60)? (i.e. What is the probability that a randomly selected aptitude test score would be at least 50 but less than 60?) What is P(60 £ X < 70)? (i.e. What is the probability that a randomly selected aptitude test score would be at least 60 but less than 70?) etc.
Q: What do we need to know to find a probability from the Normal Table (the Z table)?
A: We need to know the Z value(s).
Q: What do we need to know to find a Z value for a particular X value?
A: We need to know m and s so we can calculate: .
m and s are the 2 parameters of the Normal Distribution.
Using m = 72 and s = 8 we can calculate the Z values to find normal probabilities. NOTE: If X is assumed to be normal, then -¥£ X £ +¥.
.0987 +.3413 .4400 .4332 -.0987 .3345 .0987 .4970 -.4332 .0638 .4878 -.3413 .1465 .3413 .5 -.4970 .0030 .5000 -.4878 .0122 X 50 60 7072 80 90 100 Z -2.75 -1.50 -0.25 0 +1.00 +2.25 +3.50 .0987 .3413 .4332 .4878 .4970 .5000 .5000
Data are Normal(μ = 72, σ = 8). Data are not Normal(μ = 72, σ = 8). Goodness-of-fit test Goodness-of-fit tests are usually upper-tail tests. H0: H1: α = Decision Rule: If then do not reject H0, otherwise reject H0. Test Statistic: If all fe> 5, then one may use: Decision: Conclusion: We have found ________________ evidence at the _____ level of significance that aptitude test scores are not normal (μ = 72, σ = 8). .10 .10
Data are Normal(μ = 72, σ = 8). Data are not Normal(μ = 72, σ = 8). Goodness-of-fit test Goodness-of-fit tests are usually upper-tail tests. H0: H1: α = Decision Rule: If then do not reject H0, otherwise reject H0. Test Statistic: If all fe> 5, then one may use: Decision: Conclusion: We have found ________________ evidence at the _____ level of significance that aptitude test scores are not normal (μ = 72, σ = 8). .10 .10
In the degrees of freedom calculation: K is the number of classes that you have left after meeting the assumption of the test (fe³ 5); p is the number of parameters estimated from the sample data. Because μ and σ were given, p = 0. df = k - p -1 = 3 - 0 - 1 = 2. The critical value for the test comes from the chi-square table using df = 2.
Data are Normal(μ = 72, σ = 8). Data are not Normal(μ = 72, σ = 8). Goodness-of-fit test Goodness-of-fit tests are usually upper-tail tests. H0: H1: α = Decision Rule: If then do not reject H0, otherwise reject H0. Test Statistic: If all fe> 5, then one may use: Decision: Conclusion: We have found ________________ evidence at the _____ level of significance that aptitude test scores are not normal (μ = 72, σ = 8). df = k - p -1 = 3 - 0 - 1 = 2 .10 Χ2 = 4.6052 .10
Data are Normal(μ = 72, σ = 8). Data are not Normal(μ = 72, σ = 8). Goodness-of-fit test Goodness-of-fit tests are usually upper-tail tests. H0: H1: α = Decision Rule: If Χ2computed < 4.6052 then do not reject H0, otherwise reject H0. Test Statistic: If all fe> 5, then one may use: Decision: Conclusion: We have found ________________ evidence at the _____ level of significance that aptitude test scores are not normal (μ = 72, σ = 8). df = k - p -1 = 3 - 0 - 1 = 2 .10 DonotrejectH0 Χ2 = 4.6052 Do not reject H0. .10 insufficient