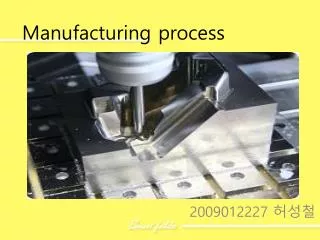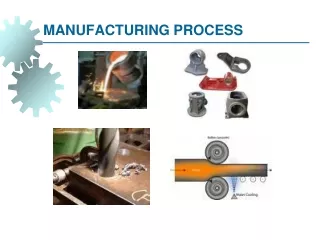
Fertilizer Manufacturing Process
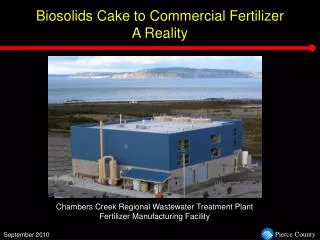
Biosolids Cake to Commercial Fertilizer A Reality. Fertilizer Manufacturing Process. Chambers Creek Regional Wastewater Treatment Plant Fertilizer Manufacturing Facility. September 2010. Digester Failure – Lime Stabilization December 2000-March 2001. Costs Excess Hauling $268,917

Fertilizer Manufacturing Process
E N D
Presentation Transcript
Biosolids Cake to Commercial Fertilizer A Reality Fertilizer Manufacturing Process Chambers Creek Regional Wastewater Treatment PlantFertilizer Manufacturing Facility September 2010
Digester Failure – Lime StabilizationDecember 2000-March 2001 Costs Excess Hauling $268,917 Equipment and Chemicals $213,363 Labor $27,085 Total Costs $509,365
The Facility Fertilizer Manufacturing Process • Operates 24 hours a day up to 7 days a week depending on operational, maintenance, and distribution strategies • Evaporates 4,400 lbs water/hour • Produces 2,400 tons of fertilizer per year • Final Product: 0.5 - 2.5 mm pellets • 93% dry solid
Fertilizer Manufacturing Process Fertilizer Manufacturing Process
Digesters Centrifuge Wet Materials Bin Recycle Bin Mixer Preseparator/Polycyclone Dryer Drum Furnace Fertilizer Vibrating Screens Pellet Cooler Bagging Silo Pneumatic Conveyor Trash Crusher
Safety Systems • Nitrogen Purge System • Activated when oxygen levels rise too high • Storage silos, recycle solids bin • Temperature sensors and water spray extinguishing system • Activated when temperature rises too high • Dryer drum • Operator interfacing with control system
2008/2009 Biogas Production Chambers Creek Regional Wastewater Treatment Plant 2008 2009
Odor Treatment • Three odor treatment systems: • Venturi Scrubbers • Building Air Scrubbers • Regenerative Thermal Oxidizer
Fertilizer Manufacturing Facility2008/2009 Operating Costs Item 2008 2009 Electricity$ 66,958 $68,353 Natural Gas $124,867 $149,376 Operations and Maintenance Staffing $199,462 $208,258 Polymer & Chemicals $316,056 $352,922 Miscellaneous (parts, bags, pallets, etc.)$ 87,928$113,558 Total $795,271 $892,467 Digester Gas Value (avoided cost) ($214,331) ($199,789)
Award Winning Facility • 2007 - Governors Award for Pollution Prevention & Sustainable Practices • 2008 - Excellence in Biosolids Management Award, Northwest Biosolids Management Association • 2009 - Recycler of the Year, Washington State Recycling Association for Public Agency Generator
SoundGRO - The Fertilizer • Current N-P-K composition 6-7-0 • pH ≈ 7 • Density - 38+ lbs/ft3 • How the nitrogen composition affects the fertilizer’s behavior • Metals and Micronutrients • Salt Index
Importance of Pretreatment - MolybdenumOur Experience • Content exceeding 75 ppm - final product cannot be classified as a Class A or B biosolid • Content exceeding 10 ppm - a warning must be put on fertilizer label • Moly is a plant nutrient and can exceed the WSDA loading limit by listing it as a micronutrient • Pretreatment research identified the source of high Molybdenum discharge source and additional limits were placed on the discharger • Concentrations have been reduced to well within acceptable levels
Establishing a Fertilizer Marketing Program • Fertilizer Product Name, Registered Trade Mark, Patent Attorney • Preliminary Marketing Study • Biosolids Testing and Agricultural Laboratory Testing • Product Logo and Bag Design • University Research Program to Validate Application Rates and NPK Composition • State Fertilizer Licenses • Washington 2005; Oregon, Idaho, Montana 2007; California 2008
Marketing Plan Target Markets: • Fertilizer Blenders, Commercial Agriculture, Golf Courses, Landscapers, Hydroseeders • Residential users, small farms, pastures, and community gardens • Competition – Primarily Commercial Fertilizers
Product Distribution & Sales • How is the product provided or sold to customers • How is the product packaged • Individual bags - 50 pound bags; • Pallets - forty 50 pound bags per pallet; • Half and one ton totes; • Bulk - truck trailer transport loaded from silos. • Commercial distributors for product • Product price -the product has value - it should be sold, not given away
SoundGRO Sales and Storage 800* 2008 700 600 400* 500 400 300 300 200 200 100 0 100 Jan Mar May July Sep Nov Feb Apr June Aug Oct Dec 0 Jan Mar May July Sep Nov Feb Apr June Aug Oct Dec Sales Storage 2009 *In tons
SoundGRO Marketing & Revenue (Excludes Labor) Marketing Costs 2008 2009 • State Fertilizer Licenses $330 $500 • State Tonnage Fees $622 $732 - Tradeshow Booth Fees $2,750$2,465 Total $3,702 $3,697 Revenue 2008 2009 - Individual Sales $34,199 $32,783 - Commercial Sales $56,652 $86,633 - Sales Taxes Collected $3,103 $3,703 - Sales Taxes Paid $3,082$3,716 Total $90,872 $119,403
Asset Management Program Utilize BCE process to determine best solution for optimizing operations, maintenance, and distributions
Fertilizer Manufacturing Facility Maintenance Requirements • Total Assets in Fertilizer Manufacturing Facility300 pieces of equipment • Manufacturer Recommended Maintenance Labor3,047 hours annually • Business Case Evaluation by Consultant Recommended 1,651 hours annually • Work Orders by Trade Mechanical – 1,122; Electrical – 222; Instrumentation – 205; Operations 116; and Miscellaneous – 24
Fertilizer Manufacturing Facility Optimization • Operations • Operational practices do not leave sufficient time for maintenance • Maintenance • Tasks based on manufacturer’s recommendation and a review to determine if bundling, delaying or removal was applicable had not been performed • Distribution • Excess product in winter requires storage, currently using Collection’s garage which displaces Collections vehicle fleet
Since the BCE Operations adopted a modified schedule for planned shutdowns Maintenance work orders and costs significantly reduced 2000 Total Preventative Maintenance WO’s Total Corrective Maintenance WO’s 1600 Total Cost Applied In thousands 1200 80 800 60 400 40 0 20 2007 2008 2009 2010ytd Total Work Order Count 0 2006 2007 2008 2009 2010ytd
Distribution Overview • Bulk customers • Golf courses, farmers, fertilizer blenders • Bag customers • Residential, distributors, lawn and landscape • Cost $450/ton to produce (2009) • Sold at • $58.40/ton ($1.46/bag) for bulk bagged product • $38.80/ton for loose bulk • $3.20/bag for individual bags
Distribution Trends Analyzed Better Understanding of Customer Buying Patterns
Distribution Customer Profile Developing a Reliable Commercial Customer Base
BCE Conclusions and Recommendations • Operations • Optimize with 10 day on/5 day off schedule • Maintenance • Optimize by going from 3,175, maintenance tasks to 1,610 • Distribution • Continue with current practice • Expand market research and determine new winter customers