Graphical Summary Reports
All Divisions. ($ in Thousands). $12,000. $120,000. $10,000. $100,000. $8,000. $80,000. $6,000. $60,000. $4,000. $40,000. $2,000. $20,000. $0. $0. Mar-09. Apr-09. May-09. Jun-09. Jul-09. Aug-09. Sep-09. Oct-09. Nov-09. Dec-09. Jan-10. Feb-10. FYTD. FY Proj. Mar-09.

Graphical Summary Reports
E N D
Presentation Transcript
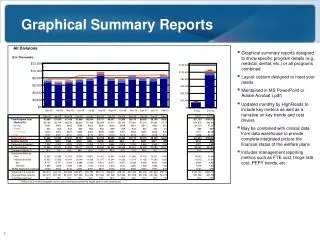
All Divisions ($ in Thousands) $12,000 $120,000 $10,000 $100,000 $8,000 $80,000 $6,000 $60,000 $4,000 $40,000 $2,000 $20,000 $0 $0 Mar-09 Apr-09 May-09 Jun-09 Jul-09 Aug-09 Sep-09 Oct-09 Nov-09 Dec-09 Jan-10 Feb-10 FYTD FY Proj Mar-09 Apr-09 May-09 Jun-09 Jul-09 Aug-09 Sep-09 Oct-09 Nov-09 Dec-09 Jan-10 Feb-10 FYTD FY Proj Total Program Cost $7,685 $7,050 $7,448 $7,958 $8,290 $9,717 $8,337 $7,854 $8,713 $8,393 $8,198 $8,927 $17,125 $105,203 - Medical/Rx $6,783 $6,144 $6,533 $6,830 $7,163 $8,594 $7,211 $6,740 $7,600 $7,276 $7,081 $7,797 $14,878 $91,642 - Dental $461 $460 $462 $598 $600 $605 $600 $599 $601 $611 $602 $612 $1,214 $7,237 - Vision $40 $45 $53 $60 $58 $48 $59 $49 $44 $34 $42 $44 $86 $647 - Life/AD&D $300 $300 $300 $356 $354 $355 $352 $351 $352 $354 $355 $355 $711 $4,263 - LTD $101 $101 $101 $114 $114 $115 $115 $115 $116 $117 $118 $118 $236 $1,414 Projected Cost $7,666 $7,650 $7,637 $8,707 $8,696 $8,738 $8,685 $8,666 $8,715 $8,775 $8,765 $8,871 $17,636 $105,288 Surplus/(Deficit) ($19) $600 $189 $750 $407 ($979) $348 $812 $1 $382 $567 ($56) $512 $85 Variance to Projected 1.002 0.922 0.975 0.914 0.953 1.112 0.960 0.906 1.000 0.956 0.935 1.006 0.971 0.999 EE Contributions $1,969 $1,974 $1,965 $2,577 $2,573 $2,584 $2,568 $2,559 $2,567 $2,584 $2,484 $2,578 $5,062 $30,847 Company Subsidy % 74% 72% 74% 68% 69% 73% 69% 67% 71% 69% 70% 71% 70% 71% Employees/Retirees - Total 12,367 12,393 12,415 13,943 13,951 14,001 13,943 13,929 13,986 14,102 14,021 14,063 14,042 14,042 - Medical Enrolled 10,450 10,453 10,441 11,049 11,039 11,077 11,044 11,023 11,074 11,162 11,592 11,628 11,610 11,610 - Ees 8,757 8,767 8,763 9,368 9,365 9,401 9,371 9,351 9,389 9,466 9,902 9,961 9,932 9,932 - Retirees 1,693 1,686 1,678 1,681 1,674 1,676 1,673 1,672 1,685 1,696 1,690 1,667 1,679 1,679 PEPM (Medical Enrollment) $735 $674 $713 $720 $751 $877 $755 $713 $787 $752 $707 $768 $737 $755 Wages ($ in thousands) $42,874 $43,102 $43,696 $49,875 $49,795 $50,175 $49,802 $49,720 $50,030 $51,256 $51,963 $52,141 $104,104 $625,510 Average Wage (actives) $51,218 $51,327 $51,931 $51,596 $51,596 $51,596 $51,596 $51,596 $51,596 $51,596 $51,596 $51,596 $51,596 $51,596 % of Wage (actives)* 16% 16% 16% 16% 16% 16% 16% 16% 16% 15% 15% 15% 15% 15% * Reflects total monthly budgeted cost for active employees divided by wages paid for active employees Graphical Summary Reports • Graphical summary reports designed to show specific program details (e.g., medical, dental, etc.) or all programs combined • Layout custom designed to meet your needs • Maintained in MS PowerPoint or Adobe Acrobat (.pdf) • Updated monthly by HighRoads to include key metrics as well as a narrative on key trends and cost drivers • May be combined with clinical data from data warehouse to provide complete integrated picture the financial status of the welfare plans • Includes management reporting metrics such as FTE cost, fringe rate cost, PEPY trends, etc.