Statistics Analysis: Z-Score and Standard Deviation in School Data
80 likes | 178 Vues
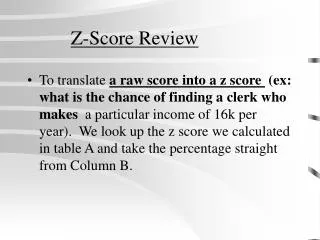
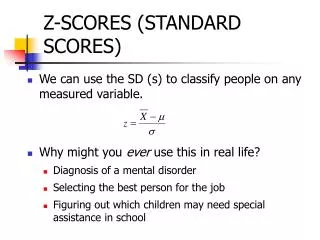
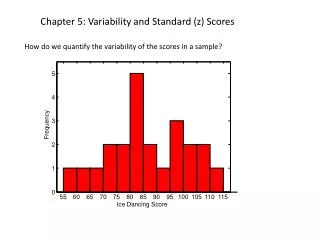
Calculate mean, SD, draw bell curves for high school boys' weights & ACT scores in KC. Connect data to Missouri school classifications. Quiz at the end.

Statistics Analysis: Z-Score and Standard Deviation in School Data
E N D
Presentation Transcript
Please write down the following data • weights of high school boy’s found in KC. 152, 197, 171, 124 ,124, 171, 113 ,182 Find the mean and Standard Deviation Then draw the bell curve (there will be a quiz and the end of the hour)
x /n
Now lets look and the data Now how would this tie into Missouri classifying schools as 2A, 3A and so on?
Please write down the following data • Act scores of students in KC. 21, 23, 17, 30, 11, 18, 22,18 Find the mean and Standard Deviation Then draw the bell curve (there will be a quiz and the end of the hour)
x /n
Now lets look and the data Now why do you think the test has really hard and really easy questions on it?
quiz 14, 15, 15, 17, 11, 15, 13, 12, 15, 13 Find the mean, Standard Deviation, and draw the bell curve, then answer the following: