Download
1 / 1
20 likes | 111 Vues
CO 2 /H 2 O (UCI). T/RH. Sonic 2D. Sonic3D. IR Sensors. Cover. Period. NEE (mg CO2 m -2 s -1 ). Total Carbon (Kg C/m 2 ). 64. 64 (UCI). Pasture wet. Apr –Jun 2001. -0.10 ±0.02. -0.21±0.04. Pasture dry. Aug - Oct 2001. -0.02 ±0.01. -0.07±0.02. 60. Bare soil. Nov - Dec 2001.

E N D
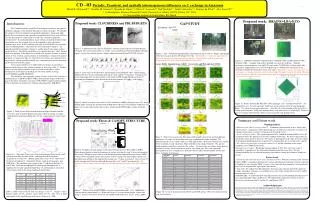
CO2/H2O (UCI) T/RH Sonic 2D Sonic3D IR Sensors Cover Period NEE (mg CO2 m-2 s-1) Total Carbon (Kg C/m2) 64 64 (UCI) Pasture wet Apr –Jun 2001 -0.10 ±0.02 -0.21±0.04 Pasture dry Aug - Oct 2001 -0.02 ±0.01 -0.07±0.02 60 Bare soil Nov - Dec 2001 +0.08 ±0.02 +0.09±0.03 50 Rice crop Mar – June 2002 -0.17 ±0.02 -0.36±0.04 45 Pasture/ Bare soil Jan-Dec 2001 -0.035±0.01 -0.30±0.08 40 40 Wind speed Bare soil/Rice Jan-Jun 2002 -0.036±0.014 -0.16±0.06 35 35 GAPS PAR 30 30 Flux tower Open area Flux Tower Closed area 25 20 20 20/20 West East 15 10 10 6 6 5 3 1.4 0.7 0.7 0.5 0.35 0.1 CD –03 Periodic, Transient, and spatially inhomogeneous influences on C exchange in Amazonia David R. Fitzjarrald (1), Osvaldo M. Moraes(2), Ricardo K. Sakai (1), Otávio C. Acevedo(2), Ralf Staebler(1) , Matt Czikowsky (1), Rodrigo da Silva(2). Alex Tsoyreff (1) (1) Atmospheric Sciences Research Center, University at Albany, SUNY Albany, NY, USA (2) Universidade Federal de Santa Maria, RS, Brasil LBA – ECO San Francisco 2002 Proposed work: DRAINO-LBA-ECO Proposed work: CLOUDINESS and PBL BUDGETS Introduction: GAP STUDY Location – km 83: The Carbon Dynamics group CD-03 investigates surface-to-atmosphere turbulent exchanges in the Amazon, focusing on carbon exchanges. We consider the symmetry between temporal and spatial discontinuities. Long term, high quality flux measurements must precede extrapolation to the basin scale, but how can one determine how representative are the sites selected for point flux measurements? If regular phenomena, many of them associated with local wind circulations exist, for example, they can be exploited to allow alternative estimates to be used. In the Santarém study area of the LBA-ECO, for example, scales of inhomogeneities range from the river-land contrast (figure 1), the agricultural field-forest contrast (figure 2), and the gap-closed canopy contrast inside the forest. Our efforts would take us to confront these less “ideal” features of the real situation. If the debate as to whether this region is a source or sink of carbon is to be resolved, careful attention to methodology is required. To achieve our goals, we analyze the data sets from the 3 tower fluxes sites (primary forest, logged forest, and an agricultural field), and 8 meteorological stations that form a mesoscale network in the region. Also a special attention is to understand how changes in agricultural practices in the Amazon alter carbon exchanges in clear areas (table 1). Another study is to relate light availability to the ecosystem to cloudiness, and to determine the result effect in the NEE, net ecosystem carbon exchange (CLOUDINESS and PBL BUDGET). New initiatives aim to quantify canopy structure to relate this structure to turbulent fluxes (CANOPY STRUCTURE), determine the impact of the forest gaps to the forest-atmosphere exchange (GAP STUDY), improve understanding of the respiration rate in forests by studying subcanopy flows (DRAINO) Figure 3: Collaboration with Univ. de São Paulo. Satellite images from the Santarém Region. Left panel: Dry season fair weather Cu; Center: 1-km resolution near Santarém; Right: Santarém region, average low cloud frequency. (Images obtained extracted from IAG-USP web site). Figure 8: Left – sketch of the gap positions surrounding the km 83 towers. Right – photograph of the chosen gap to install a 65 m high tower flux. The hypothesis is that large gaps represent preferred regions for canopy-atmosphere exchange. Measurements made near such gaps exaggerate the flux of any constituent element at the surface. Figure 11: DRAINO experiment implemented in a deciduous forest in Massachusetts (HF) (Staebler, 2003). A similar setup will be installed at several sites in Brazil. (Top left) instruments intercomparison, (top right) 2D sonic, and a CO2/H20 inlet, (bottom right), data acquisition, multiposition valve, and a CO2/H20 analyzer, (bottom left) schematics of the instruments deployed with the flux tower at the center. Hypothesis: regular subcanopy flows on calm nights can explain imbalances in the carbon budget through horizontal advection. This may be the reason that eddy flux and vertical storage lead to estimates may times smaller than what is sometimes observed in chambers. Large Eddy Simulations (LES) (Acevedo and Fitzjarrald, 2003): Figure 4: Time series of the cloud base measurements from ceilometer (dots), and the lifting condensation level (LCL) calculations from km 67 (red), and km 77 (magenta). During the wet season (top graph) there are more clouds. Notice that the PBL height depends on the km 77 meteorological conditions rather than on the local measurements of T and q at the forest. Figure 5: Hourly averaged values for LCL (left), cloud base (middle) during the year, CO2 fluxes (bottom right) using the the accumulation method (dots) and tower measurements (solid lines) for April (wet season), and October (dry season). Notice that the PBL height is deeper in the dry season. Figure 12: Results from the HF DRAINO’ 2001 campaign. Left – nocturnal wind roses. All anemometers are 1.5 m above ground. Solid lines are the contours of the terrain topography. Right - CO2 concentration and wind vectors. Also the CO2 vertical profile of the tower flux is shown in the site panel. At this site, drainage flows were observed in 1/3 of all nights. However, only 1/3 of nights with CO2 flux ‘deficits’ were associated with drainage flows. Figure 1: Wind vectors of the network of meteorological stations and flux tower sites in the Santarém Region. The panels show the hourly averaged wind speed for wind speed higher than 1.5 m/s (right) and lower than 1.5 m/s (left). U Summary and Future work Proposed work: Fluxes & CANOPY STRUCTURE tethered balloon Ongoing projects: •Monitoring the land use change at km 77. Continuous measurements of heat, water vapor, and CO2 fluxes, components of the radiation balance, and other measurements will allow us to estimate intraseasonal sensitivity of crop growth to rainfall events. • Local circulation studies. The regular appearance of a combined drainage/land breeze of the escarpment above the Tapajos river has been common knowledge. We observe this feature in Jamaraqua station (close to the river). We expect air draining down the slope above the village of Jamaraqua should integrate the respiratory CO2 emitting from the ecosystem in the airshed. • The characterization of the nocturnal boundary layer and the transition to convective conditions (see UFSM CD-03 poster). •Boundary layer budgets. Estimating regional budgets of CO2, heat, and water vapor is essential to “regionalizing” the information obtained at the flux tower sites. We have demonstrated that one can estimate boundary layer thickness using the ceilometer cloud base record. Future work: • Canopy Architecture/subcanopy light environment studies. With the assistance of Dr. Geoffrey Parker (SERC) we intend to determine the vertical and horizontal vegetation structure at the km 67 and km 83 sites using the TRAC system). Also a network of pyranometers were installed in km 67 site to determine the light regime (not shown). • Gap study. To validate the LES simulations, that large gaps represent preferred regions for canopy-atmosphere exchange, a second flux tower close to the existing tower at km 83 will be instrumented (see table 2). •DRAINO-LBA. To understand how subcanopy motions affect carbon budget measurements we have performed pilot studies at HF forest. We will perform similar observations in the two forest sites in Santarem (km 67 and km 83), and Manaus (ZF-2). Figure 9: (Top 16) Averaged scalar flux using a LES model at four levels and four different simulations. In each case the position of the gap is indicated by a thick solid line. The horizontal speed is 5 ms-1 in the wind case (from right to left). (Bottom 4) Vertical cross section of the scalar flux in each simulation. Thick solid line is the canopy boundary. The gap was found to anchor scalar fluxes emitted at the surface. The local value can 3 times larger than the horizontal average. Observation tower must be away from gaps, but, at the same time, determination of area-averaged fluxes from these observations should consider the fact that fluxes are higher near the gaps Figure 6: Examples of range fiinder system operated from the forest floor (Parker, SERC). Three adjacent height sections with contours of surface area density, each 30 m in the horizontal (the size of a TM pixel) in two forests at the Smithsonian Environment Research Center (SERC: a young (50 yr) organized canopy and a mature (110 yr) canopy with more diffuse surface area – the surface area profiles to the right are the average over 31 slices in each plot. The LAI’s are 5.5 for the younger and 4.8 for the older and the rugosities are 2.9 and 9.2 m respectively.The hypothesis is that canopy structure affects the subcanopy fluxes in regular ways across different ecosystems. Figure 4.4: (Top panel) Time series of the meteorological barbs for the wind speed measured by the sodar (black), and from the tethered balloon (magenta) at several levels. (Bottom panel) Time series of the wind vectors for the km 67 and km77, temperature (black), wind speed (magenta), and PAR (blue). The solid lines corresponds to km 77, and the dashed lines to km 67 data. Note the decoupling of the wind speed and temperature at nighttime between the agricultural field (km 77) and the primary forest (km 67) in contrast with to the strong coupling in the daytime. Acknowledgements: This work was supported by NASA as a part of the LBA-ECO program, grant NCC5-283. DRAINO Study at HF is supported by U.S. department of energy (DOE) National Institute for Global Environmental Change (NIGEC) through the NIGEC Northeast Regional Center at Harvard Forest (DOE Cooperative Agreement DE-FC03-ER 61010). We also would like to thank Dr. Geoffrey Parker (Smithsonian Environmental Research Center, Edgewater MD, USA) who provided the canopy structure figure. We would like to acknowledge Mr. Behzad Abareshi who greatly improved to the data acquisition program. Mr. Dwayne Spiess who helped in the solar panel shipment and assembly. Dr. Kathleen E. Moore improved the CO2 observation system and assisted in initial instrument installation in the field in 2000. We are grateful for the excellent logistics help from the staff at the LBA-ECO office at Santarém, especially for the efforts of Mr. Eleazar Brait, Valdelirio Miranda, Ms. Bethany Reed, and Mr. Cláudio Cota. Figure 7: Profiles of the friction velocity using two normalized heights. Left: vertical axis a ‘canopy density optical depth’ (zc); Right: one using z/h (h is the canopy height. Notice that using zc, there are two classes of curves, for broadleaf and needle leaf forests. (Sakai, 2000) Table 1: NEE values from all land use change at km 77. Negative values indicate uptake of CO2, positive values efflux of CO2. The error in NEE corresponds to the standard error of the mean. (Sakai et al., 2003) Figure 10: Levels of instruments from CD-03 and CD-04 groups (UCI) to be deployed at the gap site flux tower.