Lecture 12 Correlation and linear regression
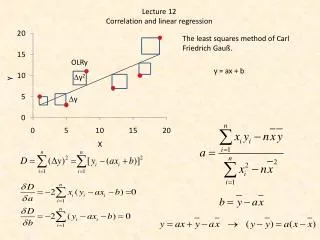
Lecture 12 Correlation and linear regression. The least squares method of Carl Friedrich Gauß . OLRy. y = ax + b. D y 2. D y. Covariance. Variance. C orrelation coefficient. Slope a and coefficient of correlation r are zero if the covariance is zero.

Lecture 12 Correlation and linear regression
E N D
Presentation Transcript
Lecture12 Correlation and linearregression Theleastsquaresmethod of Carl Friedrich Gauß. OLRy y = ax + b Dy2 Dy
Covariance Variance Correlation coefficient Slope a and coefficient of correlationrare zero ifthecovarianceis zero. Coefficient of determination
Relationshipsbetweenmacropterous, dimorphic and brachypterousgroundbeetles on 17 Mazurianlakeislands Positivecorrelation; r =r2= 0.41 Theregressionisweak. Macropterousspeciesrichnessexplainsonly 17% of thevarianceinbrachypterousspeciesrichness. We havesomeislandswithoutbrachypterousspecies. We reallydon’tknowwhatisthe independent variable. Thereis no clear cutlogicalconnection. Positivecorrelation; r =r2= 0.67 Theregressionismoderate. Macropterousspeciesrichnessexplainsonly 45% of thevarianceindimorphicspeciesrichness. Therelationshipappears to be non-linear. Log-transformationisindicated (no zero counts). We reallydon’tknowwhatisthe independent variable. Thereis no clear cutlogicalconnection.
Negativecorrelation; r =r2= -0.48 The regression is weak. Island isolation explains only 23% of the variance in brachypterous species richness. We have two apparent outliers. Without them the whole relationship would vanish, it est R20. Outliers have to be eliminated fom regression analysis. We have a clear hypothesis about the logical relationships. Isolation should be the predictor of species richness. No correlation; r =r2= 0.06 The regression slope is nearly zero. Area explains less than 1% of the variance in brachypterous species richness. We have a clear hypothesis about the logical relationships. Area should be the predictor of species richness.
Thematrixperspective X is not quadratic. Itdoesn’tpossess an inverse
Variance Covariance
Covariances Variances Thecovariancematrix issquare and symmetric
Non-linearrelationships Groundbeetles on Mazurianlakeislands Linearfunction Logarithmicfunction Power function Thespecies – individualsrelationshipareobviouslynon-linear. Thepowerfunctionhasthehighest R2 and explainstherefore most of thevarianceinspeciesrichness. Thecoefficient of determinationis a measure of goodness of fit. Slope Intercept
Havingmorethan one predictor Describespeciesrichnessindependence of numbers of individuals, area, and isolation of islands. We need a clear hypothesisabout dependent and independent predictors. Use a block diagram. Individuals Area Isolation Species
Predictorsare not independent. Numbers of individualsdepends on area and degree of isolation. We needlinearrelationships Collinearity Individuals Area Isolation Species We uselntransformedvariables of species, area, and individuals. Check for multicollinearity using a correlationmatrix. We check for non-linearitiesusingplots. Thecorrelationbetweenarea and individualsishighlysignificant. Theprobability of H0 = 0.004. Of thepredictorsarea and individualsarehighlycorrelated. In linearregressionanalysiscorrelations of predictorsbelow 0.7 areacceptable.
Thefinal data for ouranalysis Thepredictorvariableshave to containdifferentinformation. If X issingular no inverseexists ThematrixXcontainstheeffect (predictor) variables ThevectorYcontainstheresponsevariable Multiplelinearregression The model
Theprobabilitythat R2is zero isonly 0.01%. With 99.9% R2 > 0 and hencestatisticallysignificant. The model explains 78.6 % of varianceinspeciesrichness. 21.4% of avrianceremainsunexplained. Theprobabilitiesthatthecoefficientsdeviatefrom zero. Isolationis not a significantpredictor.
Whatdistance to minimize? OLRy Dy2 OLRx Dx2 Model I regression
RMA Dx Dy Reduced major axis regressionisthegeometricaverage of aOLRy and aOLRx Model II regression
Past standard output of linearregression Reduced major axis Parameters and standard errors Parametricprobability for r = 0 Permutation test for statisticalsignificance Bothtestsindicatethat Brach and Macroare not significantlycorrelated. The RMA regressionslopeisinsignificant. We don’thave a clear hypothesisaboutthecausalrelationships. In thiscase RMA isindicated.
Permutation test for statisticalsignificance g > 0 Observedr S N2.5 = 25 S N2.5 = 25 m > 0 Upper CL Lower CL Calculatingconfidencelimits Rankall 1000 coefficients of correlation and takethevaluesatrankpositions 25 and 975. Randomize 1000 times x or y. Calculateeach time r. Plot thestatisticaldistribution and calculatethelower and upperconfidencelimits.
The RMA regressionhas a much steeperslope. Thisslopeisoftenintuitivelybetter. Upper CL Thecoefficient of correlationis independent of theregressionmethod Lower CL In OLRyregressioninsignificance of slopemeansalsoinsignificance of r and R2. The 95% confidence limit of theregressionslope markthe 95% probabilitythattheregressionslopeiswithintheselimits. Thelower CL isnegative, hencethe zero slopeiswiththe 95% CL.
Outliershave an overproportional influence on correlation and regression. OLRy Dy2 Dy Outliersshould be eliminatedfromregressionanalysis. rPearson = 0.79 Normalcorrelation on ranked data Instead of the Pearson coefficient of correlationsuseSpearman’srank order correlation. rSpearman = 0.77
Home work and literature • Refresh: • Coefficient of correlation • Pearson correlation • Spearmancorrelation • Linearregression • Non-linearregression • Model I and model II regression • RMA regression • Prepare to thenextlecture: • F-test • F-distribution • Variance Literature: Łomnicki: Statystyka dla biologów http://statsoft.com/textbook/