Rio Grande Flood Study: Hydrogeological Impacts & Model Analysis
Explore groundwater response to river stage changes in the Rio Grande using high-resolution data and numerical models. Discover vertical hydraulic gradient variations during flood events and the presence of a low-permeability zone.

Rio Grande Flood Study: Hydrogeological Impacts & Model Analysis
E N D
Presentation Transcript
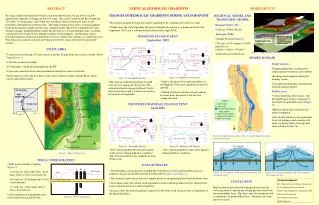
N Magdalena Mountains San Acacia Rio Grande 60 Socorro NEW MEXICO San Antonio Albuquerque Rio Grande LFCC I-25 San Marcial 380 Rio Grande Telescopic model -smaller domain -refined grid -constant head from regional model Socorro Study Area Regional model - ISC Las Cruces Texas Mexico B/C Well Gradient A/C Well Gradient River Stage DATA SUMMARY DOWNWARD FLOW B/C Well Gradient C B A UPWARD FLOW A/C Well Gradient A/B Well Gradient River Stage A/B Well Gradient DOWNWARD FLOW A and C Well Water Elevation A and B Well Water Elevation UPWARD FLOW UPWARD FLOW DOWNWARD FLOW DOWNWARD FLOW A/C Well Gradient UPWARD FLOW A/B Well Gradient ABSTRACT VERTICAL HYDRAULIC GRADIENTS MODEL SET UP CHANGES IN HYDRAULIC GRADIENTS DURING A FLOOD EVENT By using a highly instrumented 50-mile reach of the Rio Grande, we are able to see how groundwater responds to changes in the river stage. This critical reach on the Rio Grande has 154 wells, 19 stream gages, and 70 pressure transducers that record hourly water levels, providing a detailed look at flood events. This high-resolution data shows a vertical gradient between the phreatic aquifer and the semi-confined aquifer that reverses during flood events. Gradient changes during flooding confirm the presence of a low permeability zone, at a depth varying between 20 and 50 feet, identified during well installation. A preliminary surface water/groundwater interaction model depicts the low conductivity stratum as a continuous layer. Flood data and a numerical model are being used to better characterize the low permeable stratum. REGIONAL MODEL AND TELESCOPIC MODEL • The vertical gradient between the shallow and deep wells is influenced by the river stage. • Graphs show the vertical gradient between well depths in response to a monsoon flood event (September 2003) and a snowmelt/rainfall flood event (April 2004). • Regional Model - ISC • Cells are 1000x1000 feet • Telescopic Model • Smaller Domain (Figure 5) • 320 rows x 170 columns = 54400 grid cells, or 6 miles x 3 miles = 18 miles2 • Grid Cells are 100x100 feet MONSOON FLOOD EVENT September 2003 STUDY AREA Figure 5: Map showing location of the Telescopic and Regional model • 7 transects located along a 50 mile stretch of the Rio Grande from San Acacia to South of Fort Craig (Figure 1). • 154 wells monitored monthly. • 19 staff gages, owned and maintained by the ISC. • 70 pressure transducers have been installed measuring the water level hourly. • Staff Gages located in the Low Flow Conveyance Channel, the Rio Grande River, and in various agricultural drains. MODEL DOMAIN • Model Variables • Evapotranspiration is estimated for crops, riparian vegetation, and sandbars. • Recharge from irrigation during the farming season. • Constant head boundary is determined from the regional model • Model Layers • Current model has three layers, with the middle layer being a continuous 2 foot thick low permeable layer (Figure 7a). • High resolution data contradict this initial assumption. • New model will have a low permeable layer, but thickness and converge will more accurately reflect well logs and observed data (Figure 7b). Figure 3b:Highway 380 Transect. Figure 3a:Escondida Transect. • Prior to the flood event vertical gradients at the Highway 380 transect gradient are directed upward. • During the flood event the vertical gradient becomes more pronounced, but does not change direction. • The vertical gradient between the A and B wells reverses during the flood event. The vertical gradients between the B and C wells and between the A and C wells do not reverse, but increase in magnitude. SNOWMELT/RAINFALL FLOOD EVENT April 2004 Figure 6: Map showing active cells, river and channel locations, and well locations. Figure 4a:Escondida Transect. Figure 4b:Highway 380 Transect. • The vertical gradient between the A and C wells reverses during high flow conditions. The vertical gradient reacts similarly for both flood events. • The vertical gradient becomes more negative during high flow conditions. Figure 1: Map of Study Area Low Permeability Layer WELL CONFIGURATION • Wells were installed at 3 depths (Figure2). • A-wells are water table wells ~20 ft deep with a 15 foot screen interval; • B-wells are ~50 ft deep with a 5 foot screen interval; • C wells are ~100 ft deep with a 5 foot screen interval. • A discontinuous low permeable zone exists between the A and B wells. • The flood pulse creates pressure at depth due to the presence of low-permeability clay-rich sediments that are located between the A and B wells (Figure 3 and Figure 4). • This increase in pressure in the lower aquifer produces an upward gradient for both flood events. • At locations where the normal vertical gradient is downward the gradient reverses during flood events such that the flow is directed upward. • In areas where the normal gradient is upward, flood events result in an increase in magnitude of the upward gradient. Figure 7a: Conceptual model with the continuous low permeable layer. Figure 7b: Conceptual model with a discontinuous low permeable zone. Low Permeability Zone • Acknowledgments • New Mexico Interstate Stream Commission • S.S. Papodapulos &Associates Inc. • Army Corp of Engineers, Albuquerque, NM • Bureau of Reclamation • New Mexico Tech Interns • Field Volunteers CONCLUSION High resolution data shows that during flood events the vertical gradient is upward due to high pressures below the low permeability layer. This data cannot be explained with a continuous low permeability layer. Therefore, this layer must be revised. Figure 2: Well Configuration
GROUNDWATER GRADIENT REVERSAL DURING FLOOD EVENTS ALONG A CRITICAL REACH OF THE RIO GRANDE Kate Richards, Robert Bowman, Laura Wilcox, and Nabil Shafike Department of Earth and Environmental Science New Mexico Institute of Mining and Technology 801 Leroy Place Socorro NM, 87801 USA New Mexico Water Research Symposium Socorro, NM 16 August 2005