Download
1 / 1
Télécharger la présentation 
Comparative Analysis of Surface Roughness in Experimental Materials: Filler vs. Matrix Areas
An Image/Link below is provided (as is) to download presentation
Download Policy: Content on the Website is provided to you AS IS for your information and personal use and may not be sold / licensed / shared on other websites without getting consent from its author.
Content is provided to you AS IS for your information and personal use only.
Download presentation by click this link.
While downloading, if for some reason you are not able to download a presentation, the publisher may have deleted the file from their server.
During download, if you can't get a presentation, the file might be deleted by the publisher.
E N D
Presentation Transcript
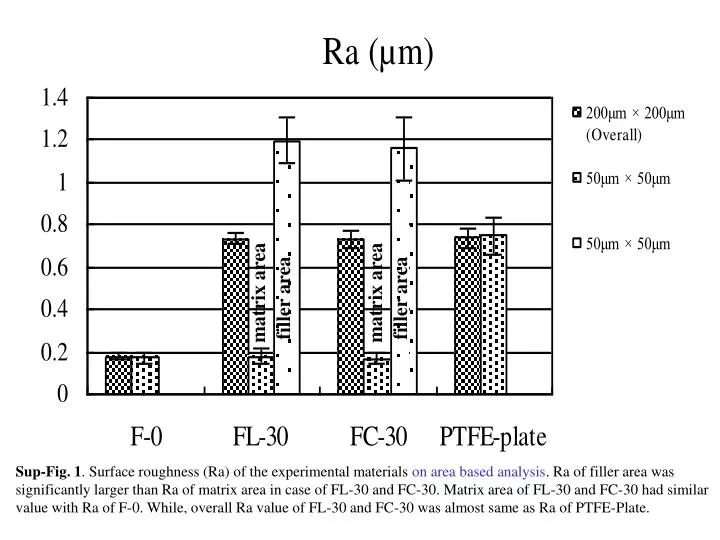
filler area filler area matrix area matrix area Sup-Fig. 1. Surface roughness (Ra) of the experimental materials on area based analysis. Ra of filler area was significantly larger than Ra of matrix area in case of FL-30 and FC-30. Matrix area of FL-30 and FC-30 had similar value with Ra of F-0. While, overall Ra value of FL-30 and FC-30 was almost same as Ra of PTFE-Plate.


More Related
Audio
Live Player