Download
1 / 26
270 likes | 448 Vues
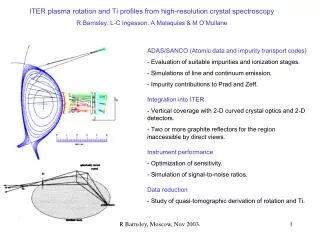
ITER plasma rotation and Ti profiles from high-resolution crystal spectroscopy R Barnsley, L-C Ingesson, A Malaquias & M O’Mullane. ADAS/SANCO (Atomic data and impurity transport codes) Evaluation of suitable impurities and ionization stages. Simulations of line and continuum emission.

E N D
ITER plasma rotation and Ti profiles from high-resolution crystal spectroscopy R Barnsley, L-C Ingesson, A Malaquias & M O’Mullane • ADAS/SANCO (Atomic data and impurity transport codes) • Evaluation of suitable impurities and ionization stages. • Simulations of line and continuum emission. • Impurity contributions to Prad and Zeff. • Integration into ITER • Vertical coverage with 2-D curved crystal optics and 2-D detectors. • Two or more graphite reflectors for the region inaccessible by direct views. • Instrument performance • - Optimization of sensitivity. • Simulation of signal-to-noise ratios. • Data reduction • - Study of quasi-tomographic derivation of rotation and Ti. R Barnsley, Moscow, Nov 2003.
ITER-98 impurity profiles R Barnsley, Moscow, Nov 2003.
ITER profiles used for SANCO and signal modelling • ADAS / SANCO modelled line/continuum ratios for H- and He-like Kr: • Chord-integrated ratios. • Reference case: f-Kr = 10-5 . Ne, Prad ~ 700 kW. R Barnsley, Moscow, Nov 2003.
ADAS / SANCO results for f-Kr = 10-5 . ne: • (Left) Ionization balance. (Right) Radiated power components and total. • Prad ~ 700 kW (integrated over plasma volume). • Zeff ~ 0.01 • Kr ionization stages down to ~ Kr 26+ have x-ray lines suitable for crystal Doppler spectroscopy. • Most of the radiated power is not in the H- and He-like stages. R Barnsley, Moscow, Nov 2003.
ADAS / SANCO results for f-Kr = 10-5 . ne: • (Left) He-like Kr 34+, 1s2-1s2p, 0.945 Å. (Right) H-like Kr 35+, 1s-2p, 0.923 Å. • Line radiation: photon/cm3.s. • Continuum: photon/cm3.s.Å. • For signal calculations, Deuterium continuum was multiplied by Zeff2 (~2.22). R Barnsley, Moscow, Nov 2003.
ITER-98 x-ray spectrometer array (XCS-A) 5 lines of sight • Provides good neutron shielding • Access to plasma remote areas • - Signal attenuation (10% transmission) • - Reflection from graphite implies • narrow bandwidth (~1%) R Barnsley, Moscow, Nov 2003.
X-ray discrete multi-chord option The new system is integrated at eport9 (16 LOS) and uport3 (5 LOS) Direct viewing lines without graphite reflectors. • Two spectral arms are used for each viewing line: • One for He like Ar (edge) • One for He like Kr (core) R Barnsley, Moscow, Nov 2003.
Multi-chord X-ray spectrometer option ISO views of eport9 R Barnsley, Moscow, Nov 2003.
Core views with continuous coverage on equatorial port 9 - Upper and lower systems give continous coverage of the plasma core r/a <~ 0.7 - Compatible with the option of discrete lines of sight, by inserting/removing shield. - Reduced number of crystals and Be windows - Spatial resolution ~10 mm. - Plasma vertical position control with soft x-ray array. - Plasma rotation measurements can still be performed by two parallel views. R Barnsley, Moscow, Nov 2003.
Two or more graphite reflector based lines of sight will complete plasma coverage R Barnsley, Moscow, Nov 2003.
Option for equatorial port - Allows continuous imaging - Minimises blanket aperture R Barnsley, Moscow, Nov 2003.
X-ray Views Referred to Mid-plane Profiles R Barnsley, Moscow, Nov 2003.
Spherically Bent Crystal + Allows plasma imaging + Improves S/N ratio with smaller entrance aperture and smaller detector fs/fm = -1/cos(2B) - No real focus for B < 45° fs: Sagittal focus fm: Meridional focusB: Bragg angle R Barnsley, Moscow, Nov 2003.
Toroidally Bent Crystal A Hauer, J D Kilkenny & O L Landen. Rev Sci Instrum 56(5), 1985. When combined with asymmetric crystal cut, gives considerable freedom in location of foci. R Barnsley, Moscow, Nov 2003.
2-D bent crystal (not to scale) • The source is deep and optically thin. • A toroidally-bent crystal is required, to place the spatial focus in the plasma. • Raw spatial resolution depends on: • - Crystal height • - Chord length in plasma • Chord-weighted emission • Optical aberrations and crystal bending • Requires / ~ 10-3 (cf. / ~ 10-4 for -focus) • For a crystal of height h: • r(Uport) ~ h/6 ~ 1 cm • r(Eport) ~ h/3 ~ 2 cm • r/r ~ 100 (optically) R Barnsley, Moscow, Nov 2003.
Detector Crystal Factors leading to choice of Bragg angle Low Bragg angle (~30°) : + Reduced dispersion: = /tan. a) Smaller first-wall penetration for a given bandwidth. b) Smaller detector movement for tuneable spectrometer. + Larger crystal radius for a given crystal-detector arm - helpful with long sight-line. + Greater choice of crystals for short wavelengths. + Detector more remote from port plug. + Reduced effect of conical ray geometry for imaging optics. - Shallower input angle to detector - parallax problems with gas-chamber detector. ~ Requires a toroidal crystal for imaging at B < 45° R Barnsley, Moscow, Nov 2003.
Detector Crystal 1 1 2 3 Effect of input geometry on Johann sensitivity Johann optics allow us to trade S/N with band-pass, while maintaining peak sensitivity at the central wavelength Shield “a” “a” Crystal filling factor a b Shield “b” c Shield “c” R Barnsley, Moscow, Nov 2003.
Parameters of the upper port imaging crystal spectrometers The upper port system consists of two spectrometers, able to observe both H- and He-like lines of Ar and Kr. Toroidally bent, asymmetrically cut, crystals give enough free parameters to: 1) Place the meridional (imaging) focus in the plasma ~6m 2) Place the sagittal (dispersion) focus in the port plug ~3m 3) Keep a compact crystal-detector arm ~1.3m Crystal toroidal radii: Sagittal ~ 4m Meridional ~ 1m Crystal aperture: ~25 x 25 mm2 Spatial resolution > 25mm Ion species B range Crystal 2d (nm) range (nm) Ar XVII / XVIII 26° -28° SiO2(1010) 0.851 0.375 - 0.400 Kr XXXV / XXXVI 26.5° - 28.5 ° Ge(440) 0.200 0.090 - 0.096 Detector: Aperture ~ 25mm x 100mm 2-D spatial resolution < 0.1mm Candidate detectors: Advanced solid state e.g. CCD, or advanced gas detector e.g. GEM. R Barnsley, Moscow, Nov 2003.
Outline detector specification • Total detector height (~800 mm) = observed plasma height (~4 m) x demagnification (~0.2) • Individual detector height: ~160 mm for 5 detectors • Detector width in direction: ~50 mm • Vertical resolution: ~5 mm, for >100 resolvable lines of sight • Horizontal resolution: ~0.1 mm • QDE / Energy range: > 0.7, 6 – 13 keV (Uport also 3 – 6 keV) • Average count rate density: ~106 count/cm2.s • Peak count rate density: ~107 count/cm2.s • n- background count density: ~104 count/cm2.s • (flux of 106 n-/cm2.s, 10% sensitivity. 90% shielding) • Candidate detectors • This performance is typical of detectors in use or in development for high-flux sources such as synchrotrons. • Gas-microstructure proportional counters. • Solid state arrays with individual pulse processing chain for each pixel. R Barnsley, Moscow, Nov 2003.
Calculated signals for reference case: • f-Kr = 10-5 . Ne Prad ~ 700 kW Zeff ~ 0.01 • Vertical image binned into 35 chords. • Poisson noise added for 100 ms integration time. R Barnsley, Moscow, Nov 2003.
Estimated Poisson signal-to-noise ratios based on counting statistics • SNR ~ (Integral counts in line) / sqrt(line + continuum + n-background). • Main noise source for data reduction is continuum, not n-background. • A wide operational space is available between 10-7 < f-Kr < 10-4. • Uses a modest instrument sensitivity of 1.4 . 10-7 cm2 per chord. (10x higher is possible). R Barnsley, Moscow, Nov 2003.
Fits to the simulated noisy raw data • Illustrative of the raw data quality – (obviously) not the best method of analysis. • Due to the narrower profile, chord-integral effects are less for H-like Kr than for He-like. • For r/a > 0.7, lower-ionized Kr ions or lower-Z impurities are required. • Under favourable conditions, a quasi-tomographic deconvolution is possible (L-C Ingesson et al). R Barnsley, Moscow, Nov 2003.