Download
1 / 20
200 likes | 323 Vues
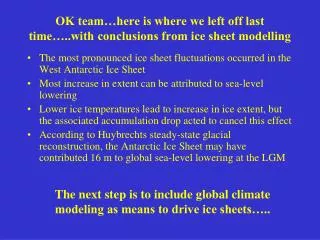
OK team…here is where we left off last time…..with conclusions from ice sheet modelling. The most pronounced ice sheet fluctuations occurred in the West Antarctic Ice Sheet Most increase in extent can be attributed to sea-level lowering

E N D
OK team…here is where we left off last time…..with conclusions from ice sheet modelling • The most pronounced ice sheet fluctuations occurred in the West Antarctic Ice Sheet • Most increase in extent can be attributed to sea-level lowering • Lower ice temperatures lead to increase in ice extent, but the associated accumulation drop acted to cancel this effect • According to Huybrechts steady-state glacial reconstruction, the Antarctic Ice Sheet may have contributed 16 m to global sea-level lowering at the LGM The next step is to include global climate modeling as means to drive ice sheets…..
Atmospheric 3-D grid-scale equations: • velocity (u,v,w) • mass • temperature • water vapor • p = R T Other equations/parameterizations: • solar radiation • infrared radiation • clouds • convection • surface boundary layer Typical surface components: • Horizontal resolution: ~200 to 500 km • Vertical levels: ~20 • Time step: ~20 minutes • soil • vegetation • snow • prescribed ice sheet • ocean • sea ice Global Climate Models – Driving Antarctic Ice with Global Climate
GCM basic equations conservation of momentum conservation of mass conservation of energy ideal gas law
Proxy climate records show inherently time-continuous sequences of change: • Long-term trends • Transitions • Transient events The Problem: Traditional “Snapshot” GCM studies do not account for the time-continuous nature of climatic change on orbital and longer time scales. (Source: Zachos et al, 2001)
Foraminifera and d18O d18O in CaCO3 precipitated from seawater f(T, d18Oseawater, metabolic effects) As T , d18O and as S , d18O In the today’s high latitude and deep ocean, DT is small, so foram d18O records changes in seawater isotopic composition In other parts of the ocean or further back in time it is often difficult to completely separate T and d18Oseawater effects
Foram d18O varies with seawater d18O because of the exchange of O isotopes between H2O and HCO3= and other C-bearing ions dissolved in seawater. H2O in the hydrosphere varies mainly because of the distillation of the lighter isotope (16O) from the heavier isotope (18O) during atmospheric processes (evaporation, transport, condensation)
FRESH WATER The Global Ocean Conveyor
How the deep oceans are ventilated: Thermohaline circulation AAIW NADW AABW