Download
1 / 34
340 likes | 539 Vues
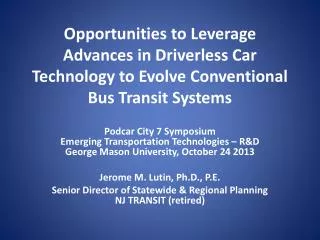
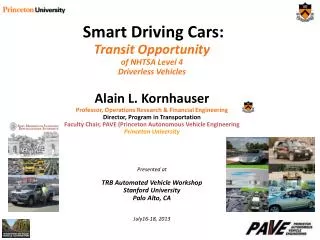
Smart Driving Cars: Transit Opportunity of NHTSA Level 4 Driverless Vehicles Alain L. Kornhauser Professor, Operations Research & Financial Engineering Director, Program in Transportation Faculty Chair, PAVE (Princeton Autonomous Vehicle Engineering Princeton University Presented at

E N D
Smart Driving Cars: Transit Opportunity of NHTSA Level 4 Driverless Vehicles Alain L. KornhauserProfessor, Operations Research & Financial EngineeringDirector, Program in Transportation Faculty Chair, PAVE (Princeton Autonomous Vehicle Engineering Princeton University Presented at TRB Automated Vehicle Workshop Stanford University Palo Alto, CA July16-18, 2013
Fundamental Value of Driverless Technology • Eliminates the Labor variable cost of transit service. • Not that significant for vehicles serving many passengers simultaneously. • Unfortunately, very little travel demand is sufficiently correlated that it can be effectively served simultaneously • For example, the small percentage of bus users need to walk, wait and transfer in order to be sufficiently correlated to utilize the capacity of buses in the peak hours in the peak directions. The rest of the time, they are essentially empty. • Very significant for vehicles serving few if any passengers simultaneously • The norm simply because there exists insufficient correlation in travel demand • Very few people want to go from about the same place at about the same time heading to locations that are sufficiently correlated such that they could be encouraged to travel together. • The opportunity of driverless vehicles is consequently directly tied to the correlation of travel demand
How Correlated is Travel Demand? • Aggregate Data on Travel Patterns suggest that it is very uncorrelated • Transit entrepreneurs and public agencies that could thrive in correlated situations struggle • The personal auto industry that could serve correlated trips thrives on serving individual trips irrespective of possible correlations. • Each car serves essentially only one fundamental travel demand. If the vehicle happens to be occupied by more than one person, then the others in the vehicle are essentially “along for the ride” and not satisfying their fundamental travel demand • One person is chauffeuring the other person • Family members traveling together to satisfy a common travel purposes • Rarely is it two independent individuals that just happened to have correlated origin, origin time, and destination. • Thus, fundamental Av Vehicle Occupancy for the personal car is ~ 1.0 • Are there independent individuals that have correlated travel demand that could be served simultaneously?
Are there independent individuals that have correlated travel demand that could be served simultaneously? Existing travel demand data is insufficiently precise to address this question
Most every day… • Almost 9 Million NJ residents • 0.25 Million of out of state commuters • Make 30+ Million trips • Throughout the 8,700 sq miles of NJ • Where/when do they start? • Where do they go? • Does anyone know??? • I certainly don’t • Not to sufficient precision for credible analysis
I’ve Tried… • I’ve harvested one of the largest troves of GPS tracks • Literally billions of individual trips, • Unfortunately, they are spread throughout the western world, throughout the last decade. • Consequently, I have only a very small ad hoc sample of what happens in NJ on a typical day.
Are there independent individuals that have correlated travel demand that could be served simultaneously? Existing travel demand data is insufficiently precise to address this question Developed a trip synthesizer that generates sufficiently precise data to address this issue
Project Overview Trip Synthesizer • Motivation – Publicly available travel demand data do not contain: • Spatial precision • Where are people leaving from? • Where are people going? • Temporal precision • At what time are they travelling?
Why do I want to know every trip? • Academic Curiosity • If offered an alternative, which ones would likely “buy it” and what are the implications. • More specifically: • If an alternative transport system were available, which trips would be diverted to it and what operational requirements would those trip impose on the new system? • In the end… • a transport system serves individual decision makers. It’s patronage is an ensemble of individuals, • I would prefer analyzing each individual trip patronage opportunity.
Synthesize from publically available data: • “every” NJ Traveler on a typical day NJ_Residentfile • Containing appropriate demographic and spatial characteristics that reflect trip making • “every” trip that each Traveler is likely to make on a typical day. NJ_PersonTrip file • Containing appropriate spatial and temporal characteristics for each trip
Creating the NJ_Residentfile for “every” NJ Traveler on a typical day NJ_Resident file Start with Publically available data:
2010 Population census @Block Level • 8,791,894 individuals distributed 118,654 Blocks.
Publically available data: • Distributions of Demographic Characteristics • Age • Gender • Household size • Name (Last, First)
Final NJ_Resident file Home County Person Index Household Index Full Name Age Gender Worker Type Index Worker Type String Home lat, lon Work or School lat,lon Work County Work or School Index NAICS code Work or School start/end time
Project Overview Overview of Trip Synthesis Generate individuals comprising the population Assign workers to work places Assign kids to schools Assign tours / activity patterns Assign other trips Assign arrival / departure times ORF 467 Fall 2012
NJ_PersonTrip file • 9,054,849 records • One for each person in NJ_Resident file • Specifying 32,862,668 Daily Person Trips • Each characterized by a precise • Origination, Destination and Departure Time
Warren County • Population: 108,692 Intra-pixel Trips
Focus of Analysis: • what is the ride-share potential? • Ridesharing delivers: • Congestion relief • Energy savings • Reduced costs/passenger • Environmental sustainability
“Pixelated” New Jersey (“1/2 mile square; 0.25mi2) • aTaxi Concept – (PRT) Model • Personal Rapid Transit Model • aTaxis operate between aTaxiStands • Autonomous vehicles wait for walk-up customers • Located in “center” of each pixel (max ¼ mile walk) • Departure is Delayed to facilitate ride-sharing • Vehicles are shared to Common Pixel destinations • aTaxi Concept – SPT Model • Smart Para Transit Model • aTaxis circulate to pick up riders in 9-Pixel area (1.5 miles on side) • Vehicles are shared to Common 9-Pixel Destinations
NJ Transit Train Station “Consumer-shed”
“Pixelated” New Jersey (“1/2 mile square; 0.25mi2) aTaxi Concept – (PRT) Model Personal Rapid Transit Model aTaxi Concept – SPT Model Smart Para Transit TransitModel Ref: http://orfe.princeton.edu/~alaink/Theses/2013/Brownell,%20Chris%20Final%20Thesis.pdf
State-wide automatedTaxi (aTaxi) • Serves essentially all NJ travel demand (32M trips/day) • Shared ridership potential:
State-wide automatedTaxi (aTaxi) • Serves essentially all NJ travel demand (32M trips/day) • Shared ridership potential:
State-wide automatedTaxi (aTaxi) • Fleet size (Instantaneous Repositioning)
State-wide automatedTaxi (aTaxi) • Abel to serve essentially all NJ travel demand (32M trips/day) • Shared ridership allows • Peak hour; peak direction: Av. vehicle occupancies to can reach ~ 3 p/v and eliminate much of the congestion • Essentially all congestion disappears with appropriate implications on the environment • Required fleet-size under 2M aTaxis (about half) • (3.71 registered automobiles in NJ (2009)
Metro Park Metuchen “Manhattan Customer-shed” Regions for NJ Transit Train Stations Edison New Brunswick Princeton Yellow Lines connect 0.25 mi2 areas to nearest NJT Train Station where Distance is a “Manhattan Metric” = |Dx|+ |Dy| Princeton Jct. Hamilton Trenton
Edison New Brunswick “Manhattan Customer-shed” Regions for NJ Transit Train Stations Princeton Yellow Lines connect 0.25 mi2 areas to nearest NJT Train Station where Distance is a “Manhattan Metric” = |Dx|+ |Dy| Princeton Jct. Hamilton