Download
1 / 29
290 likes | 423 Vues
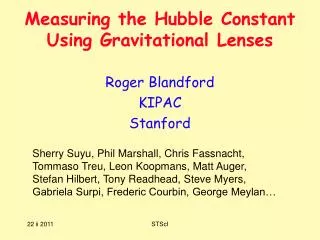
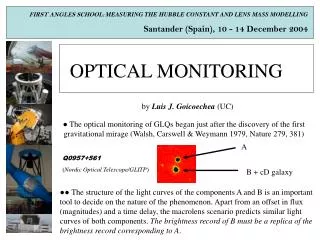
FIRST ANGLES SCHOOL: MEASURING THE HUBBLE CONSTANT AND LENS MASS MODELLING Santander (Spain), 10 - 14 December 2004. OPTICAL MONITORING. by Luis J. Goicoechea (UC).

E N D
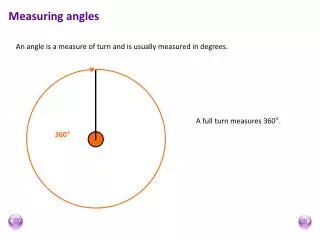
FIRST ANGLES SCHOOL: MEASURING THE HUBBLE CONSTANT AND LENS MASS MODELLING Santander (Spain), 10 - 14 December 2004 OPTICAL MONITORING by Luis J. Goicoechea (UC) ● The optical monitoring of GLQs began just after the discovery of the first gravitational mirage (Walsh, Carswell & Weymann 1979, Nature 279, 381) A Q0957+561 (Nordic Optical Telescope/GLITP) B + cD galaxy ●● The structure of the light curves of the components A and B is an important tool to decide on the nature of the phenomenon. Apart from an offset in flux (magnitudes) and a time delay, the macrolens scenario predicts similar light curves of both components. The brightness record of B must be a replica of the brightness record corresponding to A.
FIRST ANGLES SCHOOL: MEASURING THE HUBBLE CONSTANT AND LENS MASS MODELLING Santander (Spain), 10 - 14 December 2004 I. OPTICAL MONITORING (OM) PROGRAMS • THE FIRST DECADE (1980-1990) For Q0957+561 (double), the first OM programs were conducted by Lloyd (1981, Nature 294, 727), Keel (1982, ApJ 255, 20), Florentin-Nielsen (1984, A&A 138, L19), Schild & Cholfin (1986, ApJ 300, 209), Vanderriest et al. (1989, A&A 215, 1) and Schild (1990, AJ 100, 1771). On the other hand, the system PG 1115+080 (quad) was discovered in 1980 (Weymann et al. 1980, Nature 285, 641), and the pioneering analyses of variability were carried out by Vanderriest and collaborators (Vanderriest et al. 1986, A&A 158, L5: in French). The brightness changes in the double system UM 673 = Q0142-100 (Surdej et al. 1987, Nature 329, 695) was followed up by Surdej et al. (1988, A&A 198, 49), and finally, the variability of the quad system Q2237+0305 (Huchra et al. 1985, AJ 90, 691) was studied by Irwin et al. (1989, AJ 98, 1989: microlensing!) CASTLES (http://cfa-www.harvard.edu/glensdata)
FIRST ANGLES SCHOOL: MEASURING THE HUBBLE CONSTANT AND LENS MASS MODELLING Santander (Spain), 10 - 14 December 2004 • CfA-FLWO (USA) PROGRAM: Q0957+561 FOREVER Rudy Schild has devoted a big effort to follow up the flux fluctuations of the two components of Q0957+561. All the data have been taken at Fred Lawrence Whipple Observatory (1.2 m telescope) in the R band. Although the light curves (Schild & Thomson 1995, AJ 109, 1970) show a strange behaviour: “for no value of time delay do the fluctuations align” (Schild 1996, ApJ 464, 125), they permit to obtain an average delay of about 14 months: 423 6 days (Pelt et al. 1996, A&A 305, 97: dispersion method), 425 17 days (Pijpers 1997, MNRAS 289, 933: SOLA method) and 424.9 1.2 days (Ovaldsen et al. 2003, A&A 402, 891: re-reduction of data: dispersion & c2 methods). • CALTECH-Princeton-APO (USA) PROGRAM: Q0957+561 AND Q2237+0305 The Gravitational Lens Monitoring Project at Apache Point Observatory (3.5 m telescope) was not successful with the Einstein Cross (Q2237+0305). However, the collaboration got to catch two very prominent twin events in the light curves of Q0957+561A and Q0957+561B (in the g band), which led to an accurate time delay estimation of ≈ 417 days (Kundic et al. 1997, ApJ 482, 75: c2, optimal reconstruction, dispersion & cross-correlation methods).
B = red A = blue FIRST ANGLES SCHOOL: MEASURING THE HUBBLE CONSTANT AND LENS MASS MODELLING Santander (Spain), 10 - 14 December 2004 A B BA gravity (Shapiro effect) + geometry VERY PROMINENT TWIN EVENTS
FIRST ANGLES SCHOOL: MEASURING THE HUBBLE CONSTANT AND LENS MASS MODELLING Santander (Spain), 10 - 14 December 2004 • FLWO-Potsdam (USA/Germany) PROGRAM An ongoing program with the 1.2 m telescope (Fred Lawrence Whipple Observatory). Several gravitationally lensed quasars (Q0957+561, SBS 0909+523, H1413+117, B1422+231, PG 1115+080, RXJ 0911+0551 and SDSS 1004+4112) are observed in different optical filters (wavelengths). • Wise Observatory (Israel) PROGRAM Using the Wise Observatory 1m telescope, the Tel-Aviv University astronomers are monitoring in the V and R bands about 30 systems of lensed quasars, in order to detect the time-delay between the images. Recently, they measured the time delay between the two components of HE1104-1805(Ofek & Maoz 2003, ApJ 594, 101: c2 & cross-correlation methods). The new value of ≈ 160 days strongly disagrees with the previous one of about 310 days (Gil-Merino, Wisotzki & Wambsganss 2002, A&A 381, 42: dispersion & cross-correlation methods), and this system merits more attention. There is significant uncorrelated variability, and it seems that most of the uncorrelated (extrinsic) variability occurs in component A (the one nearest to the lens): microlensing fluctuations?
FIRST ANGLES SCHOOL: MEASURING THE HUBBLE CONSTANT AND LENS MASS MODELLING Santander (Spain), 10 - 14 December 2004 A = red , B = blue: time delay + linear gradient in the flux ratio B/A
FIRST ANGLES SCHOOL: MEASURING THE HUBBLE CONSTANT AND LENS MASS MODELLING Santander (Spain), 10 - 14 December 2004 Belgian-Nordic Group The Belgian-Nordic group carried out a very intense activity during the past five years. They participated in several monitoring projects and measured several time delays at optical wavelengths. PG 1115+080 (quad): DtBC = 23.7 3.4 days, DtAC ≈ 9.4 days (Schechter et al. 1997, ApJ 475, L85)
A B FIRST ANGLES SCHOOL: MEASURING THE HUBBLE CONSTANT AND LENS MASS MODELLING Santander (Spain), 10 - 14 December 2004 B1600+434 (double): 51 4 days (Burud et al. 2000, ApJ 544, 117: SOLA, dispersion, c2 & iterative methods). They used the Nordic Optical Telescope (NOT) and the I optical filter. • Problems: • Time dependent offset: microlensing? • Main event in B: anothermicrolensing? • Main events seem to be shifted in time
FIRST ANGLES SCHOOL: MEASURING THE HUBBLE CONSTANT AND LENS MASS MODELLING Santander (Spain), 10 - 14 December 2004 HE 2149-2745 (double): 103 12 days (Burud et al. 2002, A&A 383, 71: c2 method). Using the Danish 1.5 m telescope at La Silla Observatory (ESO, Chile) and the V optical filter. No problems!
FIRST ANGLES SCHOOL: MEASURING THE HUBBLE CONSTANT AND LENS MASS MODELLING Santander (Spain), 10 - 14 December 2004 RXJ 0911.4+0551 (quad): time delay of 146 8 days between A = A1 + A2 + A3 and B (Hjorth et al. 2002, ApJ 572, L11: iterative method). Using the NOT at Roque de Los Muchachos Observatory (Spain) and the I optical filter. Offset by values between -1.95 mag and – 2.05 mag
FIRST ANGLES SCHOOL: MEASURING THE HUBBLE CONSTANT AND LENS MASS MODELLING Santander (Spain), 10 - 14 December 2004 SBS 1520+530 (double): 130 3 days (Burud et al. 2002, A&A 391, 481: iterative method). Using the NOT at Roque de Los Muchachos Observatory (Spain) and the R optical filter.
FIRST ANGLES SCHOOL: MEASURING THE HUBBLE CONSTANT AND LENS MASS MODELLING Santander (Spain), 10 - 14 December 2004 FBQ 0951+2635 (double): 16 2 days (Jakobsson et al. 2004, astro-ph/0409444). Using the NOT at Roque de Los Muchachos Observatory (Spain) and the R optical filter. Problems… linear gradients… more problems… Only the last 300 days are considered…problems in the beginning: microlensing, multiple delays?
FIRST ANGLES SCHOOL: MEASURING THE HUBBLE CONSTANT AND LENS MASS MODELLING Santander (Spain), 10 - 14 December 2004 Maidanak Collaboration (Russia/Ukraine/Uzbekistan + Germany) The former Soviet Union group and the Potsdam group carry out an important activity at the Maidanak Observatory (Uzbekistan), by using the 1.5 m telescope. Joint efforts in Potsdam (Germany), Tashkent (Uzbekistan), Moscow (Russia) and Kharkov (Ukraine) permit to develop a GLQ monitoring program. The targets are: Q2237+0305 (microlensing!), SBS 1520+530, Q0957+561, SBS 0909+523, H1413+117, B1422+231, PG 1115+080, RXJ 0921+4528 and UM 673 = Q0142-100. • Spanish Collaboration The Spanish collaboration began in the summer of 1995, and it is currently conducted by the IAC (Tenerife), UC (Santander) and UV (Valencia) groups. BEFORE 1995… IN A NEAR FUTURE…
NO PROBLEMS, NO EVIDENCES IN FAVOUR OF MICROLENSING FIRST ANGLES SCHOOL: MEASURING THE HUBBLE CONSTANT AND LENS MASS MODELLING Santander (Spain), 10 - 14 December 2004 From two prominent twin events in the light curves of Q0957+561A and Q0957+561B (in the R band), the collaboration estimated an accurate time delay of 425 4 days (Serra-Ricart et al. 1999, ApJ 526, 40: d2 method). They used the Spanish 82 cm (IAC-80) telescope at Teide Observatory (Tenerife, Spain). A (time delay-advanced) = green circles B (magnitude-shifted) = red squares
FIRST ANGLES SCHOOL: MEASURING THE HUBBLE CONSTANT AND LENS MASS MODELLING Santander (Spain), 10 - 14 December 2004 What is the time delay inQ0957+561?averaged ≈ IAC events ≈ 423-425 days or APO main events ≈ 417 days? … 417 days 424 days 417 days Coming back to the APO data in the g band … (Goicoechea 2002, MNRAS 334, 905) 432 days d(DtBA) = (Dd/cDds) (1 + zd) [(qA – qB) . dr]
FIRST ANGLES SCHOOL: MEASURING THE HUBBLE CONSTANT AND LENS MASS MODELLING Santander (Spain), 10 - 14 December 2004 Other things: ● GLITP monitoring of Q2237+0305 (Alcalde et al. 2002, ApJ 572, 729) and Q0957+561 (Ullán et al. 2003, MNRAS 346, 415). Using the NOT, and the V and R filters ●● The UC group also observed Q0957+561 and SBS 0909+523 from 2003 March to 2003 June. The new VR observations were made with the 1.52-m Spanish Telescope at Calar Alto Observatory, Almeria (Spain). The analysis and interpretation of the VR light curves are in progress (in collaboration with the Oslo group) ●●● Finally, the Spanish groups are involved in two monitoring programs with the 2.00-m Liverpool Telescope, which is a fully robotic telescope at the Observatorio del Roque de Los Muchachos, La Palma (Spain). P1: Daily monitoring of SBS 0909+523 and Q0957+561 P2: Photometry and spectroscopy of several GLQs
FIRST ANGLES SCHOOL: MEASURING THE HUBBLE CONSTANT AND LENS MASS MODELLING Santander (Spain), 10 - 14 December 2004 II. OPTICALPHOTOMETRY (or MAGIC?) Due to the usual small angular separation between the lensed components and the proximity of one or several components to the lens galaxy, from ground-based frames, the photometry of a multiple QSO is remarkably complex (a magical task?). The size of the seeing disk (atmospheric effect) is of about 1-2”, i.e., similar to the typical angular size of the gravitational mirages. Double star Z Aquarii, which has a separation of 2” (Sky & Telescope, “Beating the Seeing” by A. M. MacRobert) Q0957+561 Q2237+0305 2” 6” A1+A2+A3+Lens B+Lens A+B+C+D+Lens
FIRST ANGLES SCHOOL: MEASURING THE HUBBLE CONSTANT AND LENS MASS MODELLING Santander (Spain), 10 - 14 December 2004 SOME PHOTOMETRIC TECHNIQUES(sorry if your own technique is not included here) • Deconvolution (Magain, Courbin & Sohy 1998, ApJ 494, 472: Belgian-Nordic group). This task combine all the frames (optical images) obtained at different epochs to determine the numerical light distribution of the extended source (lens galaxy) as well as the positions of the point sources (QSO components), since these parameters do not vary with time. The flux of the point sources are allowed to vary from image to image, which produces the light curves. • Aperture/PSF photometry (Serra-Ricart et al. 1999, ApJ 526, 40; Ovaldsen et al. 2003, A&A 402, 89: large separation double systems, i.e., >> 1”). For example, the PHO2COM task (by Miquel Serra) works in the following way: if the FWHM of the seeing disk is q, we initially take two circles of radius q, which are centered on the two components A and B. A reference star (reference candle) S is also encircled by a ring of radius q. 2q A B+lens
FWHM = q FIRST ANGLES SCHOOL: MEASURING THE HUBBLE CONSTANT AND LENS MASS MODELLING Santander (Spain), 10 - 14 December 2004 PHO2COM:The reference star total flux is extracted through aperture photometry with an aperture of radius 2q, i.e., we integrate the instrumental flux (counts) within a circle of radius 2q (using a clean frame, without background signal). central axis 2q FS(2q) = pixels 2q FS(pixel) S CCD pixels PSF (point spread function) fitting photometry, within the initial circle of radius q, is applied to all the objects (QSO components and reference star). Fit in 2D (e.g., Gaussian) Integration in 2D FS*(q), Fi*(q) (i = A,B) 1D: central axis for S (FS) We compute an aperture correction f = FS(2q)/FS*(q) and QSO total fluxes: Fi(2q) = f Fi*(q).
FIRST ANGLES SCHOOL: MEASURING THE HUBBLE CONSTANT AND LENS MASS MODELLING Santander (Spain), 10 - 14 December 2004 PHO2COM:Finally, one can compare the QSO component fluxes with that of the reference star. As the magnitude of an object is defined by m = - 2.5 logF + k, the component-to-star flux ratios are equivalent to magnitude differences: mi – mS = - 2.5 log[Fi(2q)/FS(2q)]. Although we dealth with a large separation (between components) system, one of its components could be close to the lens galaxy. If the component B and the deflector are close enough, and the lens galaxy is relatively bright, then the PHO2COM flux of the contaminated component (B) will be overestimated. q Excess of flux! central axis B + Lens Fit in 2D Integration in 2D FB**(q) = FB*(q) + contamination Therefore, FB(2q) = f [FB*(q) + c] and mB = mS - 2.5 log[Fi(2q)/FS(2q) + c/FS(2q)] = mS - 2.5 log[Fi(2q)/FS(2q)] – C (C > 0)
FIRST ANGLES SCHOOL: MEASURING THE HUBBLE CONSTANT AND LENS MASS MODELLING Santander (Spain), 10 - 14 December 2004 For example, the contamination of Q0957+561B in the R band at the NOT is given by a law C = mB(true) – mB(PHO2COM) = a q + b. Both the galaxy/component B confusion and the bias in the component flux from PHO2COM will depend on the seeing (FWHM = q). The contamination by galactic light can be derived from simulations or from another data processing technique (which avoids that contamination).
FIRST ANGLES SCHOOL: MEASURING THE HUBBLE CONSTANT AND LENS MASS MODELLING Santander (Spain), 10 - 14 December 2004 • Image subtraction (Alard 2000, A&AS 144, 363; Wozniak et al. 2000, ApJ 529, 88; Alcalde et al. 2002, ApJ 572, 729: bright galaxy lens). Observations of a multiply imaged QSO with a bright lens galaxy are well adapted for optimal image subtraction designed to efficiently remove the galaxy contribution without modeling its photometric profile. This task co-adds the framesto built up a deep reference frame (reference image). This reference frame is subtracted subsequently from each of the individual CCD frames in order to obtain differential images. The lens galaxy disappears “totally” after the optimal subtraction, and the observed residuals essentially correspond to the variable lensed QSO images. In the last steps (apart from the comparison with the reference star and the error estimates), one must perform a simultaneous N-PSF fittingphotometry (N is the number of QSO components) of all differential frames obtained by optimal subtraction in order to measure for each of the N lensed components the respective flux differences between each individual frame and the reference one. In order to get the absolute fluxes at all observing epochs for each of the N components, we also need to perform direct photometry on the reference frame.
FIRST ANGLES SCHOOL: MEASURING THE HUBBLE CONSTANT AND LENS MASS MODELLING Santander (Spain), 10 - 14 December 2004 OGLE collaboration: nine difference images of Q2237+0305 at various epochs (V-band)
FIRST ANGLES SCHOOL: MEASURING THE HUBBLE CONSTANT AND LENS MASS MODELLING Santander (Spain), 10 - 14 December 2004 • PSF fitting (e.g., McLeod et al. 1998, AJ 115, 137; Ullán et al. 2003, MNRAS 346, 415: CASTLES and Spanish collaborations). For example, the PSFPHOTtask is useful for extracting clean QSO fluxes (free of background signal, cross-contamination between the components and contamination by the galaxy light). The technique uses an observationally motivated 2D galaxy profile (e.g., de Vaucouleurs profile), which is convolved with a PSF to reproduce the observed lens galaxy profile. Thus the instrumental fluxes of the N QSO components and the reference star (S) can be measured by means of PSF fitting. Obviously, constant backgrounds are included to model the two regions of interest: the lens system and the S star. In this photometric procedure, the clean two-dimensional profiles of the field stars are used as empirical PSFs. Analytical PSFs are not considered (e.g., Gaussian law and so on). STEP-TO-STEP 1.- To determine the relevant information on the galaxy, the method uses the best images in terms of seeing values (superbimages). Therefore, the code is applied to each image with a seeing (FWHM) better than qlim, considering the PSF of the brightest field star and allowing all parameters to be free.
FIRST ANGLES SCHOOL: MEASURING THE HUBBLE CONSTANT AND LENS MASS MODELLING Santander (Spain), 10 - 14 December 2004 For some frames, the method could not be able to accurately extract several physical parameters of the lens galaxy, leading to results in apparent disagreement with the global distributions. Thus, in the estimation of each parameter, it is followed a scheme with two parts. First, the values with a deviation (= value - average) exceeding the standard one are dropped. Second, the parameter is inferred from the average of the "surviving" values. Finally, one obtains the morphological parameters of the galaxy (e.g., the effective radius, Reff, the ellipticity, e, and the position angle, P.A.), the relative position of the galaxy (position relative to the brightest QSO component) and the relative flux G = Flens/FS. 2.- The code is applied to all images (whatever their seeings), setting the galaxy parameters to those derived in the previous step (e.g., Reff, e, P.A., relative position and G), using galaxy fluxes given by Flens = G FS and allowing the remaining parameters to vary. In this last iteration, although all the available PSFs are used, the fluxes from the PSF of the brightest field star are regarded as the standard ones. For the i-component (i = 1,N): yi = mi – mS = - 2.5 log(Fi/FS).
FIRST ANGLES SCHOOL: MEASURING THE HUBBLE CONSTANT AND LENS MASS MODELLING Santander (Spain), 10 - 14 December 2004 The light curves yi(t) show global behaviours gi(t) that are caused by true intrinsic or extrinsic phenomena (e.g., linear trends or prominent events), as well as day-to-day variabilities, ri(t) = yi(t) – gi(t), whose interpretation is not easy: true daily fluctuations or observational noise?. For example … eA <rA2>1/2≈ 5 mmag (in principle, the residual signal contains both observational noise and true variability) gA(t) rA(t) eE= <(yE - <yE>)2>1/2≈ 4 mmag NO true variability eA≈ 5 mmag
FIRST ANGLES SCHOOL: MEASURING THE HUBBLE CONSTANT AND LENS MASS MODELLING Santander (Spain), 10 - 14 December 2004 In some systems, the situation is relatively “simple”. If the gravitational mirage consists of two QSO components, and the lens galaxy is clearly fainter than the multiple QSO, each frame (region including the system) can be explained in terms of the background signal (free parameter #1) and two light distributions with the shape of a stellar PSF [free parameters: flux of A (#2), flux of B (#3), 2D position of A (#4-5) and 2D position of B (#6-7)]. Each night, to estimate a reliable error, one may take several consecutive frames, and obtain the average value and the standard deviation of the consecutive measurements yi(1), …, yi(M). This is a statistically and physically conservative approach, because the s value is not divided by M1/2 and any possible true intraday (hourly) variation is neglected. Of course, the intrinsic uncertainty only can be tested by using complementary photometric tasks. SBS 0909+523 CASTLES (http://cfa-www.harvard.edu/glensdata) - HST image
FIRST ANGLES SCHOOL: MEASURING THE HUBBLE CONSTANT AND LENS MASS MODELLING Santander (Spain), 10 - 14 December 2004 The system SBS 0909+523:frame taken with the 1.52-m Spanish Telescope at Calar Alto Observatory, Spain c2 fit The code starts with a set of seven initial values (initial model): ptsrc[0].intens ptsrc[1].intens ptsrc[1].x ptsrc[1].y background x0 y0 Model frame Difference frame
FIRST ANGLES SCHOOL: MEASURING THE HUBBLE CONSTANT AND LENS MASS MODELLING Santander (Spain), 10 - 14 December 2004 III. TIME DELAY ESTIMATION DISPERSION METHOD (D2):Pelt and collaborators (Pelt et al. 1994, A&A 256, 775; 1996, A&A 305, 97) developed this statistical technique that is based on the minimum dispersion between the two brightness records ITERATIVE METHOD:the two light curves are correlated through an iterative procedure(e.g., Burud et al. 2000, ApJ 544, 117) CROSS-CORRELATION METHODS:there are several variants. The most sophisticated are: discrete cross-correlation function (Edelson & Krolik 1988, ApJ 333, 646), ZDCF (Alexander 1997, in Astronomical Time Series, Kluwer, p. 163) and d2 test (e.g., Serra-Ricart et al. 1999, ApJ 526, 40). This last technique (d2) is based on the expected similarity between the discrete autocorrelation function (DAC) of the light curve of one component and the discrete cross-correlation function (DCC), and it is useful to derive a very accurate delay, provided that a first (rough) estimate is known. Updated information on the d2 test and other UC group materials (software, images and so on) is available at https://grupos.unican.es/glendama/