Download
1 / 51
510 likes | 821 Vues
Determination of Lead in Dust Wipes using Field Analytical Technology. Presented by U.S. Environmental Protection Agency’s (EPA) Office of Superfund Remediation and Technology Innovation (OSRTI) and Office of Research and Development (ORD)

E N D
Determination of Lead in Dust Wipes using Field Analytical Technology Presented by U.S. Environmental Protection Agency’s (EPA) Office of Superfund Remediation and Technology Innovation (OSRTI) and Office of Research and Development (ORD) and the Department of Energy’s (DOE) Oak Ridge National Laboratory (ORNL)
Background Environmental Technology Verification Program • Early 1990s - Need for environmental technology verification identified • Slow rate of innovation; poor U.S. markets • Lack of credibility of new technologies • Inertia of system, risk aversion of purchasers and permitters • Burgeoning international market • EPA initiates ETV in October, 1995
ETV Objectives • Provide credible performance data for commercial environmental technologiesto aid • vendors in selling innovative technologies, • purchasers in making decisions to purchase innovative technologies, and • regulators in making permitting decisions regarding environmental technologies.
ETV Successes • 240 Verifications, 78 protocols to date • Vendor demand continues – over 100 technologies in testing/evaluation, over 100 applications pending • Increasing funding from vendors and others • 805 Stakeholders in 21 groups • Commendations from EPA science and policy advisory boards • Supports regulatory and voluntary Agency, other Federal and state programs • Growing international interest • New role in homeland security verifications
ETVVerifiesonly • Definition: Verifyis to determine performance under test plan defined conditions • No winners or losers • No approvals • No certification • No pass or fail • No guarantees • Responsibility rests with the technology user to correctly choose and apply technologies
Stakeholder Roles • Help set verification priorities • Review protocols and operating procedures • Review other important documents • Assist in designing and conducting outreach activities • Serve as information conduits to their constituencies
ETV Centers • ETV Air Pollution Control Technology Center • Research Triangle Institute • ETV Drinking Water Systems Center • NSF International • ETV Greenhouse Gas Technology Center • Southern Research Institute • ETV Advanced Monitoring Systems Center • Battelle • ETV Water Quality Protection Center • NSF International • ETV- Building Decontamination Center • Battelle • ETV P2 Coatings and Coating EquipmentPilot • Concurrent Technologies Corporation
46 Verifications in 2003 • AMS: 5 Arsenic Detection; 5 Mercury CEMs; 1 Onboard Mobile Emission Monitor; 1 Portable Multi-Gas Emission Monitor; 2 Multi-Parameter Water Probes; 6 Cyanide Detection Kits • SCMT: 1 Lead in Dust; 2 Groundwater Sampling Devices • APCT: 3 Mobile Source Devices • GHG: 1 Fuel Cell; 2 Micro-turbine CHP; 1 Vehicle Axle Lubricant; 1 Natural Gas Dehydration • DWS: 2 Filtration Technologies • WQP:5 Residential Nutrient Reduction Systems; 1 Animal Waste Treatment (Solids Separator); 3 UV Disinfection • CCEP: 1 Liquid Paint; 1 UV Curable Coating; 1 High Transfer Efficiency Paint Spray Gun • P2-MF: 1 Sludge Reduction
Projections for 2004 • Over 80 verifications • half in base ETV • half in homeland security technologies
ETV is partnering with .. • US National Oceanic and Atmospheric Administration • Multi-parameter water probes • US Coast Guard • Ballast water treatment • US Dept of Energy, State of Massachusetts • Continuous emission mercury monitors • US Dept of Defense • Monitors for explosives; PCBs in soils; dust suppressants • States of Alaska, Pennsylvania • Drinking water arsenic treatment • States/counties in Georgia, Kentucky, Michigan • Storm water treatment • States of New York, Colorado • Waste to energy • USDA • Ambient ammonia monitors
Note: There were 76,588 total hits and 7,075 international hits in September 2003. Total Hits International Hits www.epa.gov/etv Hits/Quarter (1998) (1999) (2000) (2001) (2002) (2003)
Getting to ETV OutcomesMeasuring outputs to outcomes Outputs Outcomes • Number of protocols and verifications • Value placed on ETV by vendors in selling and innovating technology • Value to potential purchasers; influence of ETV on purchase decisions • Use of better technologies; reduced emissions because of ETV • Reduced exposure; reduced risk because of ETV • Improved health/environmental quality because of ETV
Overview of Environmental Technology Verification Process Statisticians Project Officers Developers • Technology developers analyze randomized samples under field conditions. Samples are collected, homogenized, labeled, and assembled for distribution. Chemists Stakeholders Experimental Plan Product is report and verification statement.
Lead in Dust:Rationale for Performance Verification “Childhood lead poisoning remains a major preventable environmental health problem in the United States.” - Centers for Disease Control and Prevention “Children are most frequently lead poisoned by household lead paint dust.” - Massachusetts Dept of Public Health
Selection of the Most Appropriate Material to Test Technical panel prioritized current industry needs for evaluation of field technologies for detection of lead as: • DUST • PAINT • SOIL Greatest need
Fundamental Issue:Can Field Analytical Technology be Used to Facilitate Home Reuse Following Remediation?
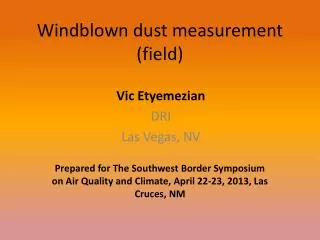
Why “dust wipes” versus “bulk dust”? • Wipe sampling estimates surface lead loading • g of lead per unit area • Risk-based dust-lead loading standards established based on dust wipe sampling • Testing under the NLLAP is restricted to dust wipes. • Readily available ELPAT samples with certified concentrations • “Real-world” samples of known content
What were the regulatory drivers for this dust wipe testing? • ETV tests provide information on potential applicability of field technologies for clearance testing. • Relevancy to clearance levels† • 40 g/ft2 floors • 250 g/ft2 window sills • 400 g/ft2 window troughs • Applications • Clearance testing • Risk assessment † Identification of dangerous levels of lead, Final Rule, 1/5/01, 40 CFR 745.65
How did we arrive at this experimental design? EPA AIHA HUD NIST NIOSH Technical Panel RTI Massachusetts ORNL VENDORS
How did we arrive at 160 samples? • Looked at all of the archived ELPAT samples; selections based on concentration and number of samples available • Requested newly-prepared samples to focus on particular clearances levels (40, 250, 400 g) • Implemented statistically-balanced design of four replicates
Determining the Number of Blank Samples to Evaluate False Positive Error Rate Confidence in the estimate of the false positive error rate increases as more blank samples are evaluated.
Attention to Clearance Levels Clearance levels Four replicate samples analyzed for each test level.
Two Very Different Analytical Techniques Verified • Portable X-ray fluorescence • Portable anodic stripping voltammetry
Vendors That Participated in the Lead in Dust ETV Tests • Niton Corporation (3 XRF systems) • Monitoring Technologies International (ASV) • Palintest (ASV) • Key Master Technologies/EDAX (XRF)
Anodic Stripping Voltammetry for Determination of Lead Pb(II) is reduced to Pb(0) by holding potential at cathodic value for brief period; Pb quantified with anodic potential sweep, measuring current for oxidizing Pb(0) to Pb(II) and stripping it from solid electrode. Anodic stripping voltammograms for the sample and two standard additions of 50 ppb Pb(II). Deposition potential = -600 mV; deposition time = 1 min.; quiet time = 10 sec. S.W. frequency = 15 Hz; step potential = 4 mV; S.W. amplitude = 25 mV Electrochemical cell uses a working (W), reference (R), and auxillary (A) electrodes in cylindrical tube with teflon cap.
Anodic Stripping Voltammetry • Advantages • Low capital cost • Disposable material • Very high sample throughput • Disadvantages • Generates small amounts of chemical waste
X-Ray Fluorescence Exposing metallic materials to high energy x-rays stimulates ejection of electrons the energies of which provide information concerning the identity of the metal in question.
X-Ray Fluorescence • Advantages • Non-destructive analysis • Produces no chemical waste • Good sample throughput • Disadvantages • High capital cost • May need radiation source license
NITON XL300 Accuracy Precision Ideal Less is better
NITON XL300 Reported Concentrations at Clearance Levels Probabilities of False Negatives
NITON XL300 Comparability: R= 0.999 (ELPAT samples); R= 0.999 (UC samples) False positive results (relative to clearance levels): 0% (0 of 12 ELPAT Samples); 0% (0 of 30 UC samples) False negative results (relative to clearance levels): 54% (15 of 38 ELPAT); 70% (21 of 30 UC samples) [25% and 77% for Reference Laboratory] Reporting limit: 15 µg/wipe Throughput (1 analysts): 40 samples/12 hr day Statistically significant negative bias (“penalty” for high precision) but within acceptable bias range.
NITON XL700 Accuracy Precision Ideal Less is better
NITON XL700 Reported Concentrations at Clearance Levels Probabilities of False Negatives
NITON XL700 Comparability: R= 0.999 (ELPAT samples); R= 0.999 (UC samples) False positive results (relative to clearance levels): 50% (6 of 12 ELPAT Samples); 62% (21 of 34 UC samples) False negative results (relative to clearance levels): 7% ( 2 of 28 ELPAT); 8% (2 of 26 UC samples) [25% and 77% for Reference Laboratory] Reporting limit: 15 µg/wipe Throughput (1 analyst): 30 - 60 samples/12 hr day Statistically significant positive bias (“penalty” for high precision) but within acceptable bias range.
NITON XLt 700 Accuracy Precision Ideal Less is better
NITON XLt 700 Comparability: R= 0.999 (ELPAT samples); R= 0.999 (UC samples) False positive results (relative to clearance levels): 8% (1 of 12 ELPAT Samples); 22% (8 of 37 UC samples) False negative results (relative to clearance levels): 29% ( 8 of 28 ELPAT); 43% (10 of 23 UC samples) [25% and 77% for Reference Laboratory] Reporting limit: 10 µg/wipe Throughput (2 analysts): 45 - 50 samples/10 hr day Statistically significant negative bias (“penalty” for high precision) but within acceptable bias range.
NITON XLt 700 Reported Concentrations at Clearance Levels Probabilities of False Negatives
Keymaster Pb-Test XRF Accuracy Precision Ideal Less is better
Keymaster Pb Test XRF Due to the positive bias at low lead levels, there was no chance of a false negative Response at the 40 µg/wipe level Reported Concentrations at Clearance Levels Probabilities of False Negatives
Keymaster Pb Test XRF Comparability: R= 0.967 (for samples ≤ 200 µg/wipe); R = 0.989 (for samples > 200 µg/wipe); False positive results (relative to clearance levels): 50% (6 of 12 ELPAT Samples); 53% (20 of 38 UC samples) False negative results (relative to clearance levels): 29% ( 8 of 28 ELPAT); 32% (7 of 22 UC samples) [25% and 77% for Reference Laboratory] Reporting limit: None provided Throughput (2 analysts and 2 instruments): 80 samples/10 hr day Statistically significant positive bias for samples ≤ 200 µg/wipe; unbiased for samples above 200 µg/wipe; acceptable precision.
MTI PDV 5000 Accuracy Precision Ideal Less is better
MTI PDV 5000 Reported Concentrations at Clearance Levels Probabilities of False Negatives
MTI PDV 5000 Comparability: R= 0.999 (for UC samples ); R = 0.988 (for ELPAT samples); False positive results (relative to clearance levels): 25% (3 of 12 ELPAT Samples); 14% (4 of 29 UC samples) False negative results (relative to clearance levels): 43% ( 12 of 28 ELPAT); 59% (17 of 29 UC samples) [25% and 77% for Reference Laboratory] Reporting limit: < 20 µg/wipe Throughput (2 analysts and 1 instrument): 80 samples/10 hr day Statistically significant negative bias; less precise than typically acceptable levels; strong linear relationship between PDV 5000 response and that of comparable lab method.
PalintestScanning Analyzer SA-5000 Accuracy Precision Ideal Less is better
PalintestScanning Analyzer SA-5000 Reported Concentrations at Clearance Levels Probabilities of False Negatives
PalintestScanning Analyzer SA-5000 Comparability: R= 1.00 (for UC samples ); R = 0.995 (for ELPAT samples); False positive results (relative to clearance levels): 0% (0 of 12 ELPAT Samples); 0% (0 of 38 UC samples) False negative results (relative to clearance levels): 61% ( 17 of 28 ELPAT); 100% (22 of 22 UC samples) [25% and 77% for Reference Laboratory] Reporting limit: < 25 µg/wipe Throughput (1 analyst and 1 instrument): 80 samples/10 hr day Statistically significant negative bias; very precise; strong linear relationship between SA-5000 response and that of comparable lab method; no false positives, high number of false negatives.
ETV Program does NOT make Head to Head comparisons of technologies, because there are needs for a variety of tools in the environmental technology toolbox
Asking: “What is the Best Technology?” is Like Asking “What is the Best Vehicle to Purchase?”It depends on what you need! Sports car vs. MiniVan PS: Your mileage may vary
Upcoming Technology Verifications by the Advance Monitoring Systems Center • More rounds of arsenic test kits for water • Multi-parameter water monitors • Ambient ammonia monitors for animal feed operations • Ammonia continuous emission monitors • Immunoassay kits for anthrax, botulinum toxin, & ricin • PCR kits for anthrax, plague, Tularemia, Brucellosis