Download
1 / 15
170 likes | 214 Vues
Learn about populations, density, dispersion, factors affecting size, survivorship curves, growth models, r-selected vs. k-selected species, and population limiting factors.

E N D
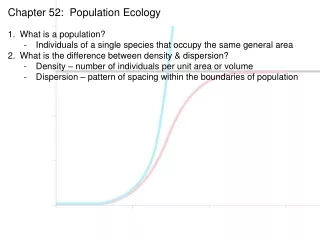
Chapter 52: Population Ecology • What is a population? • Individuals of a single species that occupy the same general area • What is the difference between density & dispersion? • Density – number of individuals per unit area or volume • Dispersion – pattern of spacing within the boundaries of population
Births and immigration add individuals to a population. Immigration Births PopuIationsize Emigration Deaths Deaths and emigration remove individuals from a population. Figure 52.2 Population dynamics Factors that influence density….. Increase Decrease
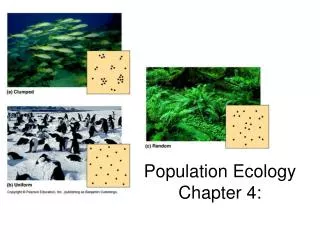
(a) Clumped. For many animals, such as thesewolves, living in groups increases theeffectiveness of hunting, spreads the workof protecting and caring for young, and helpsexclude other individuals from their territory. (c) Random. Dandelions grow from windblown seeds that land at random and later germinate. Fig. 52.3 Patterns of dispersion within a population’s geographic range (b) Uniform. Birds nesting on small islands, suchas these king penguins on South Georgia Islandin the South Atlantic Ocean, often exhibit uniformspacing, maintained by aggressive interactionsbetween neighbors.
Chapter 52: Population Ecology • What is a population? • Individuals of a single species that occupy the same general area • What is the difference between density & dispersion? • Density – number of individuals per unit area or volume • Dispersion – pattern of spacing within the boundaries of population • What factors influence population size? • Birth rate – fecundity • Death rate • Generation time • Sex ratio 4. What do the survivorship curves mean?
1,000 I 100 II Number of survivors (log scale) 10 III 1 100 50 0 Percentage of maximum life span Figure 52.5 Idealized survivorship curves: Types I, II, and III Type I – most born survive & live to their maximum life span – us – k-selected Type II – constant death rate – each day has an equal opportunity for life or death Type III – high early death rate but survivors live to maximum life span – r-selected
Chapter 52: Population Ecology • What is a population? • What is the difference between density & dispersion? • What factors influence population size? • What do the survivorship curves mean? • What are the 2 main populations growth curves? - Exponential – “J”-curve
2,000 dN 1.0N dt 1,500 dN 0.5N dt Population size (N) 1,000 500 0 0 10 15 5 Number of generations Figure 52.9 Population growth predicted by the exponential model dN = Δ population size dt = Δ time rmax = Births – deaths (intrinsic rate of increase) N = population size • Species whose population size is primarily determined by birth rate = r-selected species • “Boom & bust” cycles
Chapter 52: Population Ecology • What is a population? • What is the difference between density & dispersion? • What factors influence population size? • What do the survivorship curves mean? • What are the 2 main populations growth curves? • Exponential • Logistic
2,000 dN 1.0N Exponential growth dt 1,500 K 1,500 Logistic growth Population size (N) 1,000 dN 1,500 N 1.0N dt 1,500 500 0 0 5 10 15 Number of generations Figure 52.12 Population growth predicted by the logistic model K = carrying capacity Species whose population size is primarily determined by carrying capacity = k-selected species
Chapter 52: Population Ecology • What is a population? • What is the difference between density & dispersion? • What factors influence population size? • What do the survivorship curves mean? • What are the 2 main populations growth curves? • What is the difference between r-selected & k-selected species? r-selected (generalists) k-selected (equilibrial) Maturation time: short long Lifespan: short long Death rate high low Offspring/episode: many few Size of offspring/eggs: small large Parental care: none extensive Timing of 1st reproduction: early late in life Reproductions/lifetime: usually 1 several Examples: insects, fish, frogs mammals, birds 7. What factors limit a population?
Chapter 52: Population Ecology • What is a population? • What is the difference between density & dispersion? • What factors influence population size? • What do the survivorship curves mean? • What are the 2 main populations growth curves? • What is the difference between r-selected & k-selected species? 7. What factors limit a population? • Density – dependent factors – intensify as population size increases • Resource limitation • Health • Predation • Waste accumulation • Density – independent factors – effect population regardless of density • Weather • Climate • Environmental disasters
Snowshoe hare 160 120 Lynx 9 Lynx population size (thousands) Hare population size (thousands) 80 6 40 3 0 0 1850 1875 1900 1925 Year Figure 52.21 Population cycles in the snowshoe hare and lynx
Chapter 52: Population Ecology • What is a population? • What is the difference between density & dispersion? • What factors influence population size? • What do the survivorship curves mean? • What are the 2 main populations growth curves? • What is the difference between r-selected & k-selected species? • What factors limit a population? • How has the human population changed & how is it shown?
6 5 4 Human population (billions) 3 2 The Plague 1 0 8000 B.C. 4000 B.C. 3000 B.C. 2000 B.C. 1000 B.C. 0 1000 A.D. 2000 A.D. Figure 52.22 Human population growth (data as of 2003) - video
Rapid growth Afghanistan Decrease Italy Slow growth United States Male Female Female Male Male Age Age Female 85 85 80–84 80–84 75–79 75–79 70–74 70–74 65–69 65–69 60–64 60–64 55–59 55–59 50–54 50–54 45–49 45–49 40–44 40–44 35–39 35–39 30–34 30–34 25–29 25–29 20–24 20–24 15–19 15–19 10–14 10–14 5–9 5–9 0–4 0–4 8 8 8 6 6 6 4 4 4 2 2 2 0 0 0 2 2 2 4 4 4 6 6 6 8 8 8 Percent of population Percent of population Percent of population Figure 52.25 Age-structure pyramids for the human population of three countries (data as of 2003) Group NOT making babies Group making babies Babies Wide base = rapid growth Same width = slow growth Narrow base = decreasing