Download
1 / 7
70 likes | 94 Vues
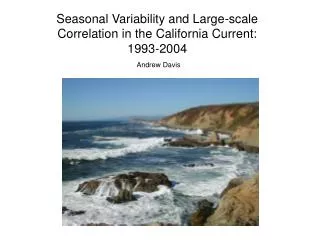
Study of air-sea heat transfer processes in the tropical Pacific Ocean using ship observations, models, and buoy data. Analysis includes meteorological conditions, cloud structures, and heat flux variations.

E N D
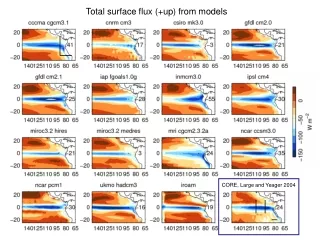
Total surface flux (+up) from models CORE, Large and Yeager 2004
NOAA ship observations • October 2001, 2003-2007 (6 years) 20˚S, 75-85˚WFall 2001, 2003, 2004, 95˚ and 110˚W, ±10˚N • Assess fluxes from ground • Investigate processes: • Surface meteorology • Turbulent and radiative fluxes • Cloud vertical structure: top, base, and LCL. • Rawinsondes • Column water vapor and liquid water path • Aerosols
20˚S surface heat fluxes 250 200 solar 150 100 net flux (W m-2) 50 sensible 0 -50 longwave -100 latent -150 -86 -84 -82 -80 -78 -76 -74 longitude
GFDL CM2.1 IROAM October heat fluxes95 & 110˚W 0 0 -40 -40 latent -80 -80 -120 -120 -160 -160 -12 -8 -4 0 4 8 12 -12 -8 -4 0 4 8 12 0 0 sensible -10 -10 -20 -20 -12 -8 -4 0 4 8 12 -12 -8 -4 0 4 8 12 0 0 -25 -25 longwave -50 -50 -75 -75 -12 -8 -4 0 4 8 12 -12 -8 -4 0 4 8 12 300 300 Model TAO buoy WHOI (1984-2002) analysis [Yu and Weller 2007] CORE (1984-2004) [Large and Yeager 2004] NOAA ship observations 250 250 solar 200 200 150 150 100 100 -12 -8 -4 0 4 8 12 -12 -8 -4 0 4 8 12 200 200 150 150 100 100 net 50 50 0 0 -50 -50 -100 -100 -12 -8 -4 0 4 8 12 -12 -8 -4 0 4 8 12 north latitude
Model WHOI ORS buoy WHOI (1984-2002) analysis CORE (1984-2004) NOAA ship observations GFDL CM2.1 IROAM October heat fluxes20˚S -40 -40 latent -80 -80 -120 -120 100 85 70 100 85 70 0 0 -10 -10 sensible -20 -20 -30 -30 -40 -40 100 85 70 100 85 70 0 0 -25 -25 longwave -50 -50 -75 -75 -100 -100 100 85 70 100 85 70 300 300 250 250 solar 200 200 150 150 100 85 70 100 85 70 160 160 120 120 80 80 net 40 40 0 0 100 85 70 100 85 70 west longitude
diurnal sampling 0 0 0 0 0 250 25 25 25 50 18 6 18 6 18 6 18 6 18 6 12 12 12 12 12 2 6 cloud top 6 5 6 1.5 7 4 6 3 7 3 3 5 3 1 5 7 3 6 5 6 6 7 3 4 5 7 3 1 4 4 6 5 4 3 5 4 height (km) 1 1 3 1 7 7 1 1 1 4 cloud base 3 4 6 6 5 1 1 4 5 1 7 7 4 6 3 6 4 7 1 1 5 6 1 6 1 6 3 7 5 7 7 5 5 5 7 4 7 4 1 3 4 0.5 surface LCL 3 4 3 0 -85 -82.5 -80 -77.5 -75 degrees longitude cloud height