Chapter 2 - Probability
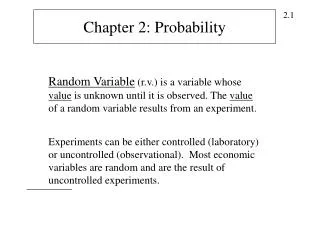
Chapter 2 - Probability. 2.1 Probability Experiments. A six sided die was rolled repeatedly to determine if there was a tendency for one number to be rolled more than the others. The results are displayed in the graph below. Roll of a Die. Frequency. Number Rolled. Outcome

Chapter 2 - Probability
E N D
Presentation Transcript
Chapter 2 - Probability 2.1 Probability Experiments
A six sided die was rolled repeatedly to determine if there was a tendency for one number to be rolled more than the others. The results are displayed in the graph below. Roll of a Die Frequency Number Rolled
Outcome • A possible result of an experiment
Outcome • A possible result of an experiment Event • A set of outcomes with the same result
Outcome • A possible result of an experiment Event • A set of outcomes with the same result • Trial • One round of a probability experiment
Outcome • A possible result of an experiment Event • A set of outcomes with the same result • Trial • One round of a probability experiment • Experimental Probability • Determined using the results of an experiment or simulation
The event that we are looking for is a 1 being rolled. That outcome will be defined as out “successful” trial. How many times was a 1 rolled?
The event that we are looking for is a 1 being rolled. That outcome will be defined as out “successful” trial. How many times was a 1 rolled? • A roll of 1 was recorded to have happened five times.
The event that we are looking for is a 1 being rolled. That outcome will be defined as out “successful” trial. How many times was a 1 rolled? • A roll of 1 was recorded to have happened five times. • How many times was the die rolled in total (what were the total number of trials)?
The event that we are looking for is a 1 being rolled. That outcome will be defined as out “successful” trial. How many times was a 1 rolled? • A roll of 1 was recorded to have happened five times. • How many times was the die rolled in total (what were the total number of trials)? • 5 + 3 + 2 + 4 + 4 + 7 = 25
What is the experimental probability of a rolling a 1? Express as a fraction, decimal and percent.
What is the experimental probability of a rolling a 1? Express as a fraction, decimal and percent.
What is the experimental probability of a rolling a 1? Express as a fraction, decimal and percent.
What is the experimental probability of a rolling a 1? Express as a fraction, decimal and percent. 0.2 X 100% = 20%
What is the experimental probability of not rolling a 1? Express as a fraction, decimal and percent?
What is the experimental probability of not rolling a 1? Express as a fraction, decimal and percent? • The probability of not rolling a 1 would be • P(Not 1) = 20/25 = 4/5 • 4/5 = 0.8 • 0.8 X 100% = 80%
How would you expect the heights of the bars to relate to each other?
How would you expect the heights of the bars to relate to each other? • Because each number should have been equally likely to be rolled, the bar graph should have had all bars of equal height.
How would you expect the heights of the bars to relate to each other? • Because each number should have been equally likely to be rolled, the bar graph should have had all bars of equal height. • This is the difference between theoretical and experimental probability. In the experiment, it is possible that the same number could be rolled over and over again in each of the 25 trials. • Experimental probability is a measure of what actually happened, not what is expected to happen.
Homework: Read Example 2 on page 64-65 Do p. 66 # 1 – 4, 7, 9