Download
1 / 18
180 likes | 289 Vues
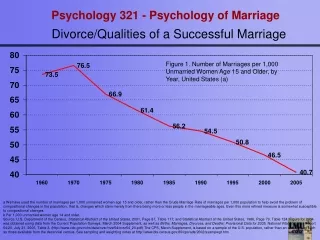
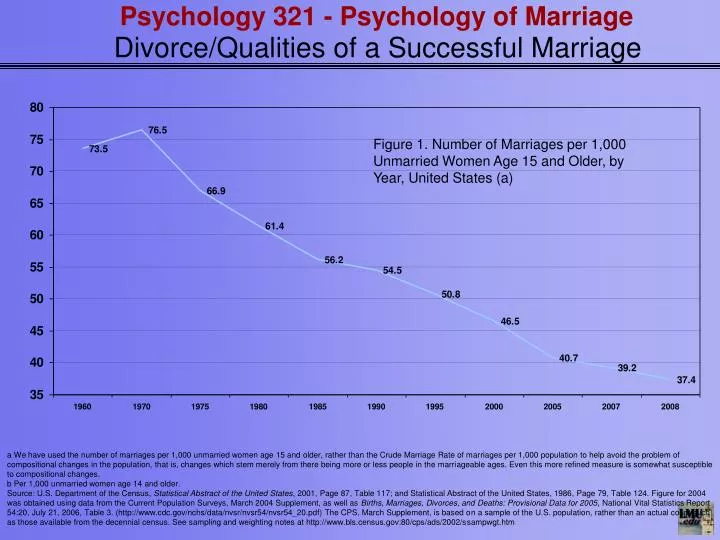
Figure 1. Number of Marriages per 1,000 Unmarried Women Age 15 and Older, by Year, United States (a).

E N D
Figure 1. Number of Marriages per 1,000 Unmarried Women Age 15 and Older, by Year, United States (a) a We have used the number of marriages per 1,000 unmarried women age 15 and older, rather than the Crude Marriage Rate of marriages per 1,000 population to help avoid the problem of compositional changes in the population, that is, changes which stem merely from there being more or less people in the marriageable ages. Even this more refined measure is somewhat susceptible to compositional changes. b Per 1,000 unmarried women age 14 and older. Source: U.S. Department of the Census, Statistical Abstract of the United States, 2001, Page 87, Table 117; and Statistical Abstract of the United States, 1986, Page 79, Table 124. Figure for 2004 was obtained using data from the Current Population Surveys, March 2004 Supplement, as well as Births, Marriages, Divorces, and Deaths: Provisional Data for 2005, National Vital Statistics Report 54:20, July 21, 2006, Table 3. (http://www.cdc.gov/nchs/data/nvsr/nvsr54/nvsr54_20.pdf) The CPS, March Supplement, is based on a sample of the U.S. population, rather than an actual count such as those available from the decennial census. See sampling and weighting notes at http://www.bls.census.gov:80/cps/ads/2002/ssampwgt.htm
Figure 3. Percentage of Persons Age 35 through 44 Who Were Married by Sex, 1960-2005, United States Source: U.S. Bureau of the Census, Statistical Abstract of the United States, 1961, Page 34, Table 27; Statistical Abstract of the United States, 1971, Page 32, Table 38; Statistical Abstract of the United States, 1981, Page 38, Table 49; and U.S. Bureau of the Census, General Population Characteristics, 1990, Page 45, Table 34; and Statistical Abstract of the United States, 2001, Page 48, Table 51; internet tables (http://www.census.gov/population/socdemo/hh-fam/cps2005/tabA1-all.pdf) and data calculated from the Current Population Surveys, March 2006 Supplement. Figure for 2006 was obtained using data from the Current Population Surveys rather than data from the census. The CPS, March Supplement, is based on a sample of the U.S. population, rather than an actual count such as those available from the decennial census. See sampling and weighting notes at http://www.bls.census.gov:80/cps/ads/2002/ssampwgt.htm
Figure 4. Percentage of Married Persons Age 18 and Older Who Said Their Marriages Were "Very Happy," by Period, United States
Figure 5. Number of Divorces per 1,000 Married Women Age 15 and Older, by Year, United States
Figure 8. Fertility Rates, 1960-2004, Number of Births per 1,000 Women Age 15 through 44, United States
Figure 9. Percentage of Households with a Child or Children Under Age 18, 1960-2010, United States
Figure 10. Percentage of Children Under Age 18 Living with A Single Parent, by Year and Race, United States
Figure 11. Percentage of Children Under Age 18 Living with Two Married Parents, by Year and Race, United States
Figure 12. Percentage of Live Births that Were to Unmarried Women, by Year, United States
Figure 13. Number of Cohabiting, Unmarried, Adult Couple of the Opposite Sex Living with One Child or More Under Age 15, by Year, United States
Figure 14. Percentage of High School Seniors Who Said Having A Good Marriage and Family Life Is "Extremely Important," by Period, United States
Figure 15. Percentage of High School Seniors Who Said It Is Very Likely They Will Stay Married to the Same Person for Life, by Period, United States
Figure 16. Percentage of High School Seniors Who Said that they Agreed or Mostly Agreed that Most People will have Fuller or Happier Lives if they Choose Legal Marriage Rather than Staying Single or just Living with Someone, by Period, United States.
Figure 17. Percentage of High School Seniors Who Said Having a Child Without Being Married is Experimenting with a Worthwhile Lifestyle, or Not Effecting Anyone Else, by Period, United States
Figure 18. Percentage of High School Seniors Who ”Agreed” or “Mostly Agreed” with the Statement that “It is Usually a Good Idea for a Couple to Live Together Before Getting Married in order to Find Out Whether they Really Get Along, “ by Period, United States.