Brainstorming
Opposing Idea 1. Idea 1. Idea 4. Supporting Idea 1. Idea 2. Supporting Idea 3. Idea 3 based on 1 and 2. Extension to Idea 1. Supporting Idea 3. Brainstorming. Flow Charts. Process Flow Diagram (PFD). 0. 5. Municipal Water Supply. Main Entrance. Scale. metres. Exit. Entry.

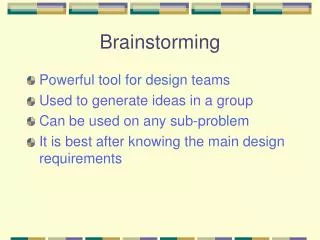
Brainstorming
E N D
Presentation Transcript
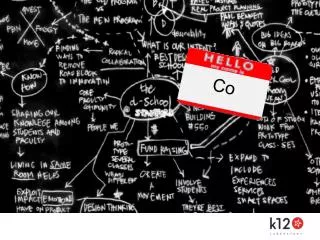
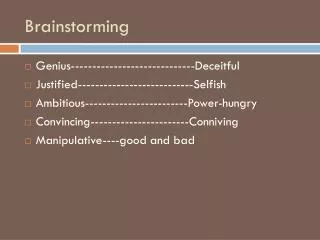
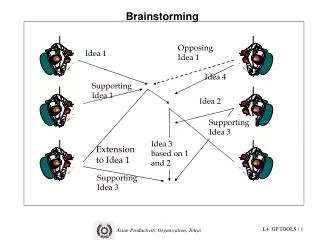
Opposing Idea 1 Idea 1 Idea 4 Supporting Idea 1 Idea 2 Supporting Idea 3 Idea 3 based on 1 and 2 Extension to Idea 1 Supporting Idea 3 Brainstorming
0 5 Municipal Water Supply Main Entrance Scale metres Exit Entry N ETP Finished Product Storage Raw Material Storage Quality Control and Final Packaging Administrative Block Utilities 101.5m 30m Stack for emissions Manufacturing Process Line Prod. Capacity 10,000 product items per day Central Highway 05 Toilet Block Laboratories Proposed Production line of capacity 10,000 product items per day 100m 100.5m 101m Plant Layout
Filter Problem Area Plating bath 1 Plating bath 2 Recovery tank Work Jobs Cleaning area Location of spillage during each monitoring Concentration Diagrams
Checksheets Number in a week No. of instances lights were kept on by the customer while leaving the room Number of instances water was left running by the customers Number of customers who demand daily change of room linens, towels…(unused)
Checklists could be developed on the following activities: Monitoring and Maintenance Changing equipment, processes and operations Checklists
Using Checklists as pointers to generate new GP Options Materials and Inventory Meeting environmental compliance Training and Human Resource Development
Material Balance- Illustration from a textile dyeing mill
Energy Balance- Illustration from a textile dyeing mill
Material and Energy Balance Illustration from a textile dyeing mill
Cause-Effect Analysis Ishikawa (Fishbone) Diagram
Failure Mode Effect Analysis GP Option Direct reuse of dyebath Restrict reuse only for disperse dyebaths Problems leading to failure Shades not matching with standard ` Shades not matching with standard Detection 9 9 Likelihood of occurrence 8 3 Cost liability due to failure 8 8 Risk Priority Number 576 216 ` Corrective Measure Restrict reuse only for disperse dyebaths
GP Costs incurred Benefits obtained Profitability Analysis Cost Benefit Analysis • Simple payback; • Net Present Value; • Internal Rate of Return
Example of CBA when there is no Capital Investment Combined Scour-Bleach in a Cotton Textile Unit in Egypt
Example of CBA when there is Capital Investment White Water / Fiber Reuse in Pulp and Paper Industry Annual Savings * $350,670 Financial Indicators Simple Payback period 4.19 years Net Present Value - Years 1-15 $359,544 Internal Rate of Return - Years 1-15 21% *Annual operating cash flow before interest and taxes Capital Costs Saveall Equipment $345,985 Saveall and White Water Pump Materials $374,822 Piping, Electrical, Instruments and Structural Installation $397,148 Engineering $211,046 Contingency $140,403 Equipment Life 15 years Borrowing Rate of Interest 15% Total Capital Costs $1,469,404
To compare operating practices with norms prevalent in the industry the Benchmarking tool could be used: Norms /best practices Actual practice internal i.e., between functions, departments or a similar organization as a means of improving performance; competitive i.e., comparison across industries within a given sector aimed at establishing best practice through identification of gaps in performance. This can be done on product, functional, departmental or on a company-wide basis. comparativei.e., across all business sectors aimed at establishing best practice in all areas of operation (this type of benchmarking is restricted to common processes or technologies (sector non-specific) across business sectors) Benchmarking
For knit fabric industry the following norms are used: Energy consumption 70 MJ / Kg of fabric Dye consumption 4 g/Kg of fabric Water consumption 120 L/Kg of fabric Comparison With Norms to Identify Problem Areas
GP Options Sieve Method to eliminate the most unsuitable Weighted Sum Method to rank the GP options to select the most suitable option Most Suitable GP Option Decision Matrix