Download
1 / 52
520 likes | 544 Vues
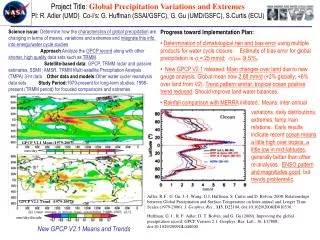
Explore current changes in tropical precipitation extremes in climate models compared to observations. Understand implications for society and the hydrological cycle response to global warming. Analyze the response of clear-sky radiative cooling to warming, moisture trends, and precipitation shifts. Investigate contrasting precipitation responses and examine observed data against model simulations. Discover projected changes in tropical precipitation and the sensitivity of trends to instrument algorithms.

E N D
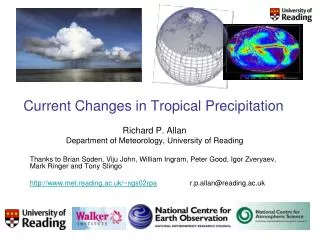
Present day changes in tropical precipitation extremes in models and observations Richard P. Allan Environmental Systems Science Centre, University of Reading With thanks to: Brian Soden (RSMAS, University of Miami) Viju John (Hadley Centre)
Climate ImpactsHow the hydrological cycle responds to global warming is crucial for society (e.g. water supply, agriculture, severe weather) Motivation
Earth’s energy balance Kiehl and Trenberth, 1997; Also IPCC 2007 tech. summary, p.94
Earth’s energy balance SW heating +67 Wm-2 LW cooling -169 Wm-2 Precip: +78 Wm-2 Kiehl and Trenberth, 1997; Also IPCC 2007 tech. summary, p.94
How does clear-sky radiative cooling respond to warming? 1K increase in tropospheric T, constant RH Greenhouse gas changes from 1980 to 2000 assuming different rates of warming TOA SFC ATM ATM Clear-sky Longwave shortwave Clear-sky net cooling increases at ~3 Wm-2K-1
Increase in atmospheric cooling over tropical ocean descent ~4 Wm-2K-1 CMIP3 volcanic Reanalyses/ Observations AMIP3 CMIP3 non-volcanic
CMIP3 MODELS: Tropical oceans Increases in water vapour enhance clear-sky longwave radiative cooling of atmosphere to the surface This is offset by enhanced absorption of shortwave radiation by water vapour See Lambert and Webb (2008)
Models simulate robust response of clear-sky radiation to warming (~2 Wm-2K-1) and a resulting increase in precipitation to balance (~2%K-1) e.g., Allen and Ingram, 2002; Lambert and Webb, 2008 Lambert and Webb (2008) submitted
But moisture observed & predicted to increase at greater rate ~7%K-1 (e.g. Soden et al. 2005, Science) • Thus convective rainfall expected to increase at a faster rate than mean precipitation (e.g. Trenberth et al. 2003 BAMS) 1979-2002
Contrasting precipitation response expected “heavy rain”: ~7 % K-1 7 % K-1 Mean: ~2 % K-1 ∆P (%) “light rain”: –XX % K-1 ∆T (K) Held and Soden (2006) J. Clim
Changes in precipitation: “the rich get richer”? precip trends 0-30oN Rainy season: wetter Dry season: drier Chou et al. 2007 GRL
Is this contrasting precipitation response borne out by observations? • Method: Analyse separately precipitation over the wet ascending and dry descending branches of the tropical circulation • Use reanalyses to sub-sample observed data • Employ widely used precipitation datasets • Compare with atmosphere-only and fully coupled climate model simulations
Tropical Precipitation Response Allan and Soden, 2007, GRL GPCP CMAP • Model precipitation response smaller than the satellite observations see also discussion in: Wentz et al. (2007) Science, Yu and Weller (2007) BAMS, Roderick et al. (2007) GRL, Chou et al. (2007) GRL, Zhang et al. (2007) Nature Trenberth and Dai (2007) GRL Lambert and Webb (2008) AMIP3
Tropical Subsidence regions dP/dt ~ -0.1 mm day-1 decade-1 OCEAN LAND AMIPSSM/I GPCP CMAP
Projected changes in Tropical Precipitation Allan and Soden, 2007, GRL
Sensitivity to SST (top) and CWV (bottom): more consistent with models Tropical ocean ascent AMIP3 CMIP3 non-volcanic CMIP3 volcanic Reanalyses/ Observations
Are observed trends sensitive to instrument/ algorithm? (Viju John) Tropical ocean ascent
Can precipitation response to ENSO be used as a test of model sensitivity?
Changes in tropical precipitation frequency Histograms of the frequency of precipitation in bins of intensity (e.g. 0-10%, …, 80-90%, 90-95%, 99-100%). Test model precipitation response to ENSO (+B.Soden)
Based on response to warming during ENSO, models: • Underestimate increases in frequency of heaviest precipitation • Produce spurious decrease in frequency of moderate precipitation and increase frequency in lightest rainfall
Based on response to warming during ENSO, models: • Underestimate increases in frequency of heaviest precipitation • Produce spurious decrease in frequency of moderate precipitation and increase frequency in lightest rainfall
Based on response to warming during ENSO, models: • Underestimate increases in frequency of heaviest precipitation • Produce spurious decrease in frequency of moderate precipitation and increase frequency in lightest rainfall
Satellite data suggests that mean precipitation and evaporation changes appear to be closer to Clausius Clapeyron (7%/K), larger than the model estimates (Wentz et al. 2007, Science) This appears to require super-Clausius Clapeyron changes in moist-region precipitation? Yu and Weller (2007) BAMS
Vecchi and Soden (2006) Nature • Evidence for weakening of Walker circulation in models and observations
Vecchi and Soden (2006) Nature • Evidence for weakening of Walker circulation in models and observations
Mishchenko et al. (2007) Science Also: Liepert and Prevedi (2008) submitted to J Clim Could decadal changes in aerosol have short-circuited the global water cycle through direct and indirect effect on cloud radiation?
Summary • Global water and energy cycles coupled • Theoretical changes in clear-sky radiative cooling of atmosphere implies “muted” precipitation response • Models simulate muted response, observations show larger response • Possible artifacts of data? • Possible mechanisms (aerosol, cloud) • Implications for climate change prediction
Precipitation also linked to clear-sky longwave radiative cooling of the atmosphere
Increased moisture enhances atmospheric radiative cooling to surface SNLc = clear-sky surface net down longwave radiation CWV = column integrated water vapour ERA40 NCEP dSNLc/dCWV ~ 1 ─ 1.5 W kg-1 dCWV (mm) Allan (2006) JGR 111, D22105
Global precipitation (P) changes constrained by atmospheric net radiative cooling (Q) • Changes in Q expected to be ~3 Wm-2K-1 (e.g. Allen and Ingram, 2002) • If so, changes in P with warming ≈3%K-1 • …substantially lower than changes in moisture (~7%K-1)
Global precipitation (P) changes constrained by atmospheric net radiative cooling (Q) • Changes in Q expected to be ~3 Wm-2K-1 (e.g. Allen and Ingram, 2002) • If so, changes in P with warming ≈3%K-1 • But convective rainfall supplied by moisture convergence which increases at rate ~7%K-1 e.g. Allen and Ingram (2002) Nature; Trenberth et al. (2003) BAMS
Are the results sensitive to the reanalysis data? • Changes in the reanalyses cannot explain the bulk of the trends in precipitation
Tropical ocean variability SST Water vapour Clear LW net down at surface
Increased moisture enhances atmospheric radiative cooling to surface SNLc = clear-sky surface net down longwave radiation CWV = column integrated water vapour ERA40 NCEP dSNLc/dCWV ~ 1 ─ 1.5 W kg-1 dCWV (mm) Allan (2006) JGR 111, D22105
dCWV/dTs ~ 3.0±1.0 mm K-1 Linear fit dSNLc/dTs ~ 3.5±1.5 Wm-2K-1 Models, reanalyses and observations show increased surface net downward longwave with warming due to increased water vapour CMIP3 non-volcanic CMIP3 volcanic Reanalyses/ Obs AMIP3
Clear-sky outgoing longwave radiation (Wm-2) ERA40 NCEP-1 AMIP ensemble ERBS/ScaRaB/CERES GISS_E_R volcanic ensemble
Clear-sky outgoing longwave radiation (Wm-2) ERA40 NCEP-1 AMIP ensemble ERBS/ScaRaB/CERES GISS_E_R volcanic ensemble
Radiative cooling/Latent heating ─ OBS ─ ERA40 --- NCEP Clear-sky atmospheric longwave cooling ─ SSM/I AMIP3GISSvolc Precipitation
Summary • Global water and energy cycles coupled • Satellite data and models agree on rate of moisture increase with temperature (~7%/K) increased radiative cooling of atmosphere to the surface • Theoretical changes in clear-sky radiative cooling of atmosphere implies “muted” precipitation response • Models simulate muted response, observations show larger response • Models severely underestimate precipitation response in ascending and descending branches of tropical circulation • Possible artifacts of data? • Implications for climate change prediction
But water vapour is rising at a faster rate (~7%/K) Convective rainfall draws in moisture from surroundings
Increase in clear-sky longwave radiative cooling to the surface ∆SNLc (Wm-2) CMIP3 CMIP3 volcanic NCEP ERA40 SSM/I-derived ~ +0.7 Wm-2 decade-1
Calculated trends • Models understimate mean precipitation response by factor of ~2-3 • Models severely underestimate precip response in ascending and descending branches of tropical circulation
Tropical Subsidence regions dP/dt ~ -0.1 mm day-1 decade-1 OCEAN LAND AMIPSSM/I GPCP CMAP
Are the results sensitive to the reanalysis data? • Changes in the reanalyses cannot explain the bulk of the trends in precipitation