Control
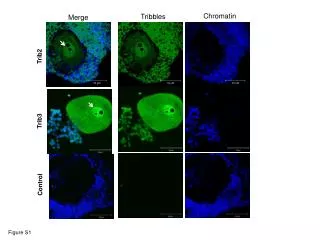
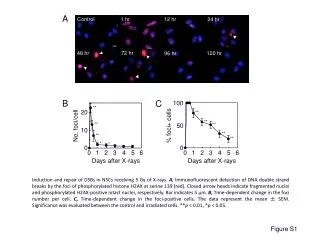
A. 1 hr. 12 hr. Control. 24 hr. 72 hr. 48 hr. 120 hr. 96 hr. B. C. 100. 20. **. **. No. foci/cell. % foci+ cells. 50. 10. **. **. **. **. 0. 0. **. **. 0. 1. 2. 3. 4. 5. 6. 0. 1. 2. 3. 4. 5. 6. *. *. Days after X-rays. Days after X-rays.

Control
E N D
Presentation Transcript
A 1 hr 12 hr Control 24 hr 72 hr 48 hr 120 hr 96 hr B C 100 20 ** ** No. foci/cell % foci+ cells 50 10 ** ** ** ** 0 0 ** ** 0 1 2 3 4 5 6 0 1 2 3 4 5 6 * * Days after X-rays Days after X-rays Induction and repair of DSBs in NSCs receiving 5 Gy of X-rays. A, Immunofluorescent detection of DNA double strand breaks by the foci of phosphorylated histone H2AX at serine 139 (red). Closed arrow heads indicate fragmented nuclei and phosphorylated H2AX-positive intact nuclei, respectively. Bar indicates 5 µm. B, Time-dependent change in the foci number per cell. C, Time-dependent change in the foci-positive cells. The data represent the mean ± SEM. Significance was evaluated between the control and irradiated cells. **p < 0.01, *p < 0.05. Figure S1