Maldi-tof
Maldi-tof. Basics on Voyager. Basics on Maldi-Tof Basics sample preparation Resolution Delayed Extraction Guide wire/Beam steering Reflector Instrument tuning Calibration Theory. Sample plate. Extraction grids. Reflector detector. Linear detector. Timed ion selector.


Maldi-tof
E N D
Presentation Transcript
Basics on Voyager..... • Basics on Maldi-Tof • Basics sample preparation • Resolution • Delayed Extraction • Guide wire/Beam steering • Reflector • Instrument tuning • Calibration Theory
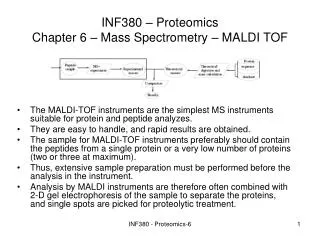
Sample plate Extraction grids Reflector detector Linear detector Timed ion selector Reflector Laser Camera Pumping Pumping INLET ION SOURCE MASS FILTER DETECTOR Sample plate HPLC GC Solids probe MALDI API/Electrospray IonSpray EI, CI TOF Quadrupole Ion Trap Magnetic Sector FTMS “Hybrid” Microchannel Plate Electron Multiplier Components of a Mass Spectrometer
Voyager-DE STR Voyager-DE and DE PRO Applied BiosystemsMALDI-TOF instruments
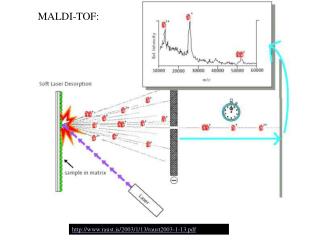
+ + + + Ion Source: MALDI (Matrix Assisted Laser Desorption Ionisation) Laser flash produces matrix (M) neutrals, positive, negative ions and sample neutrals. M M*, MH+, (M-H)- Sample molecules (A) are ionised by gas phase proton transfer MH++A AH++M (M-H)-+A AH-+M
Ions of same mass, different velocities + + + + + + + + + + + + 0 kV 150 nsec Detector 2: Expansion of the ion cloud in the absence of an electric field +20 kV 3: Field applied. Gradient accelerates slow ions more than fast ones. + +20 kV 4: Slow ions catch up with faster ones at the detector Delayed Extraction (DE) 0 kV 0 nsec 1: Laser fired. Formed ions detach from plate in the absence of an electric field
2 KE t2 m/z = s2 Flight tube + + + + Detector Ions with different mass, same Kinetic Energy + + + + + + Detector Ions with lighter mass will fly faster and will reach the detector first + + Flying times of the ions are proportional to m/z ratios Mass Filter: TOF (Time Of Flight)
Mass Filter: Reflector TOF The electrical field applied within the reflector produces an ion mirror effect directing the ions towards a second detector • Improvement in resolution by • Increasing the effective flight length of the tube • Re-focusing of analogous ions having slight different energy due to initial spread in the ion source
Hydrophobic surface Voyager Sample Plates SURFACE TENSION
MALDI-TOF Matrices Sinapinic acid (3,5-Dimethoxy-4-hydroxy cinnamic acid) -cyano-4-hydroxycinnamic acid 2,5-dihydroxybenzoic acid (2,5-DHB) Peptide (0.1-10 pmol/l) Protein (0.1-10 pmol/ l) Oligonucleotide (10-100 pmol/ l) Polymer (10-4M) 2,4,6-trihydroxy acetophenone (THAP) 2-(4-hydroxyphenylazo)-benzoic acid (HABA) trans-3-indoleacrylic acid Dithranol 3-hydroxypicolinic acid (3-HPA)
Matrix Preparation and Crystals Sinapinic acid DHB Super-DHB a-cyano 10 g/L in 30-50% ACN with 0.1% TFA 10 mg/ml in water or 50% ACN A = 10 mg/ml DHB in 20% ACN B = 10 mg/ml 5-methoxysalicylic acid in 50% ACN Combine A:B (9:1) 5 mg/ml in 50% ACN 0,1% TFA
Dried Droplet First sample Immediately after, matrix in solvent Sandwich Method First matrix Then sample And matrix again (air dry) Thin Layer (Nitrocellulose) NC and matrix solution (dry) Then sample (dry) TFA on top, blow off with an air supply; repeat Thin Layer (Acetone) First matrix in acetone (dry) Thensample (dry) On-plate washing possible after drying
Resolution - 1 • What benefit is high resolution • Improved identification of peptides • Indication of potential modification • Greater degree of mass accuracy • Resolution is defined as : Mass / (peak width at half peak height)
S=DM S=2DM DM NOT RESOLVED FULLY RESOLVED Resolution - 2 R=M/DM, where M is the mass to of peak and DM is the peak width at half maximum. S= peak separation.
Consequence of High Resolution • The Grey lines indicate the isotopic distribution of the peptide. • The Red line indicates the centroid mass data for each. • Resolution 1000 = 1297.000 (Average Mass) • Resolution 3000 = 1296.680 (Monoisotopic Mass) RESULT = Better Mass Accuracy
2 x C13 C13 C12 : 5730.61 High Resolution - Too much data?Monoisotopic resolution of Insulin In compounds with more than 100 carbon atoms the height of the 13C isotope peak exceeds the height of the 12C peak
Fraction of second post laser fire Acceleration 25KV + + + + + Grid 0% (0KV) Ground Acceleration 25KV + Acceleration 25KV + + + + + + + + + Grid 0% (0KV) Ground Ground NO Delayed extraction
+ + + + + Ground Fraction of second post laser fire + + + + + + Acceleration Acceleration 25KV Acceleration + + + + + + + + + + + + + + Grid 60% (15KV) Ground Ground Ground Ground Delayed extraction
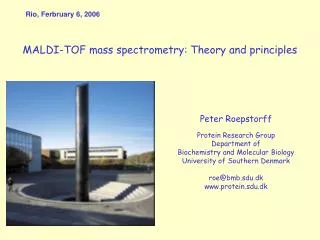
Principle of Delayed Extraction When ions are accelerated they exhibit a broad energy spread. When forming ions in a weak electric field then applying a high voltage pulse after a time delay, this energy spread can be minimized. A potential gradient is formed in the ionization region by the voltages applied to the sample plate and the variable voltage grid. Ref: W.C.Wiley and I.H.McLaren Rev.Sci.Instrum 1953,26,1150-1157
continuous extraction R=650 delayed extraction R=11,000 delayed extraction R=1,100 continuous extraction R=125 6130 6140 6150 6160 6170 10600 10800 11000 11200 11400 11600 m/z m/z Delayed Extraction - Why Reflector mode Linear mode
Benefits of Using a Reflector • Provides higher performance - resolution and mass accuracy • Increases separation due to longer flight time • Filters out neutral molecules • Corrects time dispersion due to initial kinetic energy • distribution • Capability for PSD experiment
Schematic of Voyager DE-PRO and DE-STR Systems Linear detector Reflector detector Sample plate Extraction grids Timed ion selector Reflector Laser Beam guide Camera Pumping Pumping
What is the reflector? • The reflector is an electrical mirror with a voltage potential applied across the sides. • The ions are sequentially slowed down through the reflector
Velocity Focusing in Reflector Mode Ions must line up at the beginning of the flight tube Slow Fast slow slow fast fast Variable-voltage grid Defocusing region Ground grid Sample plate This initial focus is refocused by the reflector which can be fine tuned for second order velocity focusing. Refocusing region - some move farther into reflector, than others
CALIBRATION THEORYDefinitions Accuracy, Precision & Resolution • a. Precision. This is a measure of repeatability, i.e. the degree of agreement between individual measurements of a set of measurements, all of the same quantity. • b. Accuracy. This is a measure of reliability, and is the difference between the True Value of a measured quantity and the Most Probable Value which has been derived from a series of measures. The True Value is, of course, never known. • c. Resolution. This is the smallest interval measurable by an instrument
CALIBRATION THEORY None of the darts are close to the true value (bull’s eye) : the measurements are not accurate. Also, since the darts are not very close to each other, the set of measurements is notprecise either. Since all of the measurements are close together, they areprecise, but since they are not close to the true value, they are not accurate The measurements are all close to the true value, so they are accurate. Also, the measurements are all close to each other, so they are precise
CALIBRATION THEORYDefinitions • Accuracy : in ppm (or Da, or %) • 100 ppm = 0,01% • 10 ppm = 0,001% • 1 ppm = 0,0001% • Resolution : in FWHM (Full Width at Half Maximum) - No unit = M/DM
Res = 18100 8000 21 ppm error 6000 Res = 14200 Counts 4000 28 ppm error Res = 4500 2000 55 ppm error 0 2840 2845 2850 2855 Mass (m/z) CALIBRATION THEORYDefinitions
Iterative CalibrationApproach 2) Apply calibration to sample 3) Database search 4) Internally calibrate using “hits” and resubmit 1500 2000 2500 1296.6801 1) Calibrate on standards 2093.0846 2465.2024 904.4711 1570.6783 3657.9231 1000 1500 2000 2500 3000 3500
In-Gel Digest Hit List :Automated Close External Calibration Rank Digest # # (%) SwissProt Species MW (Da) Protein Name 120060 4/16 (25%) P15992YEAST 23748.5 HEAT SHOCK PROTEIN 26. 234118 3/16 (18%) P08468 YEAST 94523.6 PET111 PROTEIN PRECURSOR. 234931 3/16 (18%) P25301 YEAST 52247.7 DNA REPAIR PROTEIN RAD57. 237093 3/16 (18%) P10664 YEAST 38961.1 60S RIBOSOMAL PROTEIN L2A (RP 237100 3/16 (18%) P49626 YEAST 38931.0 60S RIBOSOMAL PROTEIN L2B (RP2). 254802 3/16 (18%) P38863 YEAST 96825.4 HYPOTHETICAL 96.8 KD PROTEIN Detailed Results 1. 4/16 matches (25%). YEAST. HEAT SHOCK PROTEIN 26. ( 23748.5 Da) submitted matched ppm start end Peptide Sequence Modifications 1274.6610 1274.6017 46.5200 117 126 (K)DIDIEYHQNK(N) 1461.8579 1461.7953 42.8103 176 189 (K)ADYANGVLTLTVPK(L) 1729.9719 1729.9012 40.8452 160 175 (R)VITLPDYPGVDADNIK(A) 1886.0931 1886.0024 48.1161 159 175 (K)RVITLPDYPGVDADNIK(A) 12 unmatched masses: 888.3 998.6 1139.6 1211.8 1225.8 1288.7 1314.8 1350.7 1537.3 1788.0 1820.0 2041.1 The matched peptides cover 19% (41/213 AA's) of the protein.