Enhancing Emergency Response Planning through ERP Classification
270 likes | 376 Vues
This presentation outlines the stages of Emergency Response Planning (ERP) classification at sub-precinct scales developed by David Tetley. The presentation covers the limitations of current ERP classification approaches and introduces the concept of precinct scales. It delves into the automated ERP classification process at lot scale and pixel scale, discussing the challenges and advantages of each. The presentation concludes with a discussion on future work and improvements in the ERP classification process.

Enhancing Emergency Response Planning through ERP Classification
E N D
Presentation Transcript
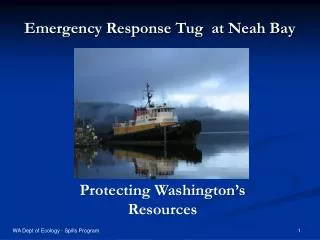
Emergency Response Classificationsat Sub-Precinct Scales David Tetley
Presentation Outline Background Stage 1 ERP Classifications (Lot Scale) Stage 2 ERP Classifications (Pixel Scale) Discussion
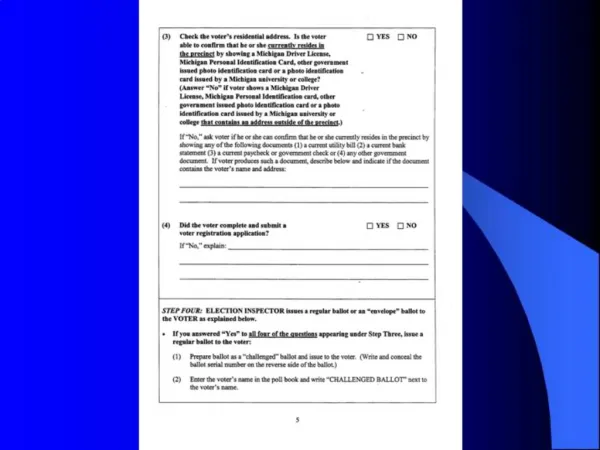
Why Complete Emergency Response Planning? Key component of FPRM process is managing the continuing flood risk. A key component of managing the continuing flood risk is ensuring Emergency Response Planning (ERP) is completed. “Flood Emergency Response Planning Classification for Communities” (2007) guideline prepared to assist in assigning ERP classifications to floodplain communities: Table 1: Response Required for Different ERP Classifications (DECC, 2007)
Current ERP Classification Approach From: “Flood Emergency Response Planning Classification for Communities” (DECC, 2007)
Limitations of Current ERP Classification Approach What is a “precinct”? Broad scale classifications can make it difficult to prioritise emergency response requirements within precincts. Does not take full advantage of spatial datasets that are commonly produced as part of contemporary studies. “Precinct” approach focused on existing communities.
Stage 1 ERP Classification (Lot Scale) • Computer program developed to automate ERP Classifications. • Required Inputs: • Digital Terrain Model (DTM) • GIS file of sub-precincts (e.g., lots) • GIS file of road network • Hydraulic model water level output file • Probable Maximum Flood (PMF) extent polygon • A range of “default” parameters
Stage 1 ERP Classification (Lot Scale) • Computer program performs the following tasks: • Analyses the road network and PMF extent to determine which roads serve as evacuation routes to points outside of floodplain • Determines when roadways become cut by floodwater preventing vehicular and pedestrian evacuation • Determines which precincts become isolated during the flood • Determines which precincts become flooded during the flood • Assigns ERP Classifications to each precinct
Stage 1 ERP Classification (Lot Scale) LEGEND 1% AEP Depths (m)
Stage 1 ERP Classification (Lot Scale) LEGEND 1% AEP Depths (m) Vehicular evacuation route 0 hours after rainfall commences (1% AEP Flood)
Stage 1 ERP Classification (Lot Scale) LEGEND 1% AEP Depths (m) Vehicular evacuation route 2 hours after rainfall commences (1% AEP Flood)
Stage 1 ERP Classification (Lot Scale) LEGEND 1% AEP Depths (m) Vehicular evacuation route 8 hours after rainfall commences (1% AEP Flood)
Stage 1 ERP Classification (Lot Scale) LEGEND 1% AEP Depths (m) Pedestrian evacuation route 9 hours after rainfall commences (1% AEP Flood)
Stage 1 ERP Classification (Lot Scale) LEGEND 1% AEP Depths (m) Pedestrian evacuation route 18 hours after rainfall commences (1% AEP Flood)
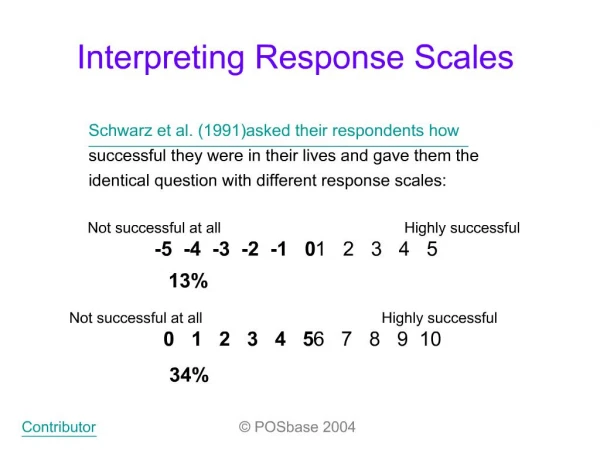
Stage 2 ERP Classification (Pixel Scale) Some limitations were identified in ERP Classification flow chart at small scales Alternate ERP Classification was developed based on analysis of individual “pixels” (i.e., grid cells) Alternate approach considers same basic ERP factors but results are presented on a “gradient” of 13 classifications of increasing risk / emergency response requirements
Stage 2 ERP Classification (Pixel Scale) Definitions of Risk Gradient ERP Classifications
Stage 2 ERP Classification (Pixel Scale) LEGEND Time of First Inundation (1% AEP Flood)
Stage 2 ERP Classification (Pixel Scale) LEGEND ERP Gradient (1% AEP Flood – Existing Conditions)
Stage 2 ERP Classification (Pixel Scale) LEGEND ERP Gradient (1% AEP Flood – Existing Conditions)
Stage 2 ERP Classification (Pixel Scale) LEGEND ERP Gradient (1% AEP Flood with Upgraded Roadway )
Disadvantages Significant amount of pre-processing may be required Significant computational time (60km2, ~30000 lots & 2m pixel size = 12 hours) Information overload?
Future Work Including additional criteria to determine when evacuation routes become cut Customised assessment of vulnerable community assets (e.g., hospitals, retirement villages, schools) Potential for different pedestrian/overland escape routes relative to vehicular escape routes Optimising software for improved run-times
Conclusion Limitations identified with ERP classification workflow when applied at small scales Automated ERP classification is possible at small scales and offers a range of useful information to assist with emergency response management. ERP “gradient” approach has potential to offer improved spatial definition of emergency response requirements Further improvements to computer program planned