Download
1 / 19
200 likes | 416 Vues
Albuquerque, NM, USA. Measuring Natural Frequency and Non-Linear Damping on Oscillating Micro Plates. Hartono Sumali. ICEM 13 Alexandroupolis, Greece July 1-5, 2007.

E N D
Albuquerque, NM, USA Measuring Natural Frequency and Non-Linear Damping on Oscillating Micro Plates Hartono Sumali ICEM 13 Alexandroupolis, Greece July 1-5, 2007 Sandia is a multiprogram laboratory operated by Sandia Corporation, a Lockheed Martin Company,for the United States Department of Energy’s National Nuclear Security Administration under contract DE-AC04-94AL85000.
Nonlinear damping is important in MEMS • Motivation: • Micro plates are very important in many microsystems applications. • Squeezed-film damping determines the dynamics of plates moving a few microns above the substrate. Examples abound in • MEMS accelerometers. • MEMS switches. • MEMS gyroscopes. • Measurement of damping in MEMS has not been as extensively explored as the modeling. • Published measurements have not addressed the nonlinearity inherent to the variation of the thickness of the squeezed film gap throughout the oscillation cycle. • Methods for measuring nonlinear dynamic responses are not sensitive enough to measure damping nonlinearity. • Objective: • Provide experimental method to measure time-varying damping on MEMS.
Squeezed fluid film damps oscillation. Gap thickness h Time Plate oscillates freely at fequency w. Oscillating plate z a y Substrate h b Gas gap x The squeezed fluid between the plate and the substrate creates damping force that reduces the oscillation with time.
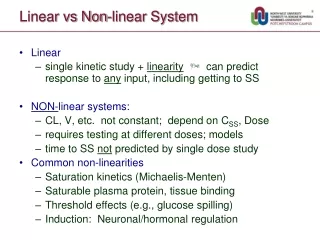
The oscillating plate can be modeled as SDOF. Equation of motion Free vibration of the plate resembles a decaying sinusoid. Squeeze-film damping was theoretically predicted to be nonlinear. Higher when plate is closer to substrate. Lower when plate is farther from substrate. Textbook log-decrement method cannot capture nonlinear damping.
Non-linear damping gives different decay envelope than linear damping. Displacement of a damped non-linear oscillation: Displacement of a linearly damped free oscillation: • Damping ratio varies with time, displacement, etc. • Decay envelope has time-varying exponent. Damping ratio is constant Due to the squeezed film, nonlinear damping distorts the oscillation from pure sinusoids.
Hilbert transform gives decay envelope. • is an imaginary signal that is 90o lagging from phase from the real signal v(t). The Hilbert transform of a signal v(t) is • The |vector sum| of the real signal and the imaginary signal is the amplitude |V|(t) v(t) • The amplitude of a decaying sinusoid is the envelope
Decay envelope can be curve-fit for linear parameters. + - + Measured data Imaginary part v(t) Hilbert transform Envelope Curve fitting Linear damping Curve fitting of the envelope gives • product of • linear damping • natural frequency • initial amplitude Non-linear damping
Signal phase can be curve-fit for linear parameters. |V|(t) v(t) Oscillation frequency is time derivative of signal phase Linear: Non-linear: is a function of t. Signal phase can be obtained from the Hilbert transform Curve fitting of the signal phase gives • oscillation frequency • initial phase Natural frequency is zwn was obtained from envelope curve fitting. Therefore, damping z can be obtained as z = zwn / wn
Test structure is oscillated through its supports. Air gap between plate and substrate. Mean thickness = 4.1 mm. 1. Substrate is shaken up and down. 2. Plate moves up and down. 3. Springs flex. 4. Air gap is compressed and expanded by plate oscillation. • A laser Doppler vibrometer (LDV) measured the plate velocity v(t).
Measurement uses LDV and vacuum chamber. • Piezoelectric actuator shakes the substrate (base). • Structure oscillates. • Base excitation is then cut out abruptly. • Structure’s oscillation rings down. • Scanning Laser Doppler Vibrometer (LDV) measures velocities at several points on MEMS under test. Microscope Die under test Laser beam Vacuum chamber PZT actuator (shaker)
Preliminary experimental modal analysis gave natural frequency, mode shapes, linear damping. Measured deflection shape, first mode. Higher modes are not considered. 16910Hz. Up-and-down. 27240Hz 33050Hz
Test data were the ring-down portion of free response. High-pass filtering removed DC offset, and suppressed low-frequency drifts. Oscillation was built up and then rung down. Discrete Fourier Spectra of Raw and Filtered Response Velocities. Response Velocity for 2.9Torr
Hilbert transform gave the decay envelope. Envelope Measured Analytic Representation of the Free Decaying Velocity.
Nonlinear damping was orders of magnitude lower than linear damping. Linear fit matched the envelope very closely. Amplitude as a Function of Time: Fit Values Versus Measured Data. Total Damping Ratio as a Function of Time.
Nonlinear damping was captured as a function of displacement and velocity. The method extracted the nonlinear part of the damping ratio, even though that part was orders of magnitude smaller than the linear part. Nonlinear Damping Ratio as a Function of Velocity. Nonlinear Damping Ratio as a Function of Displacement. The nonlinear damping appears to be a function of velocity rather than displacement.
Conclusions: • The measurement and data processing technique resulted in accurate estimates of oscillation frequency and linear damping ratios. • Linear damping ratio can be obtained by curve-fitting the decay envelope. • The method extracted the nonlinear part of the damping ratio, even though that part was orders of magnitude smaller than the linear part. • The nonlinear damping appears to be a function of velocity rather than displacement.
Acknowledgment • The authors thank the following contributors: • Chris Dyck and Bill Cowan’s team for providing the test structures. • Dan Rader for technical guidance and programmatic support. Questions ?? Thank you! hSumali@Sandia.gov Sandia is a multiprogram laboratory operated by Sandia Corporation, a Lockheed Martin Company,for the United States Department of Energy’s National Nuclear Security Administration under contract DE-AC04-94AL85000.
Classic Experimental Modal Analysis also gave natural frequency, damping and mode shapes • LDV measured transmissibility at 17 points on the plate and springs. • Frequency response function (FRF) from base displacement to gap displacement: = Transmissibility - 1 are curve-fit simultaneously using standard Experimental Modal Analysis (EMA) process. • Commercial EMA software gave natural frequency, damping, and mode shapes.
Differentiation can result in large noise. Differentiation with time resulted in unacceptably large noise. • Curve fitting of the signal phase can be done to obtain a very close representation of the phase angle as an analytical function of time. • Then the oscillation frequency can be obtained as the analytical derivative of that representation.