Evaluation of USPS Battery Tray Assembly Under Impact Conditions: Methodology and Design Modifications
290 likes | 403 Vues
This report evaluates the USPS battery tray assembly's performance during impact scenarios based on a revised methodology. Initial velocities were applied at mounting points, assuming rigid mounts and isotropic materials. Key findings include peak tensile stress evaluations and bolt force analysis for NCAP and Side pulses. Design modifications were proposed, notably increasing the RTM base thickness from 2 mm to 4 mm to enhance load-bearing capacity. Stress distribution and compliance with safety thresholds were assessed, indicating improved performance in modified designs.

Evaluation of USPS Battery Tray Assembly Under Impact Conditions: Methodology and Design Modifications
E N D
Presentation Transcript
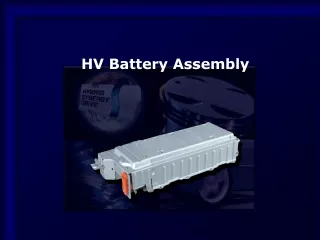
USPS BATTERY TRAY ASSEMBLY FEA Project Report
Background • Based on the review of Phase 3 report with A123, we were • asked to incorporate a different methodology. • The new methodology consisted of applying initial velocities • along with the full pulse at the mounting points.
Methodology/Assumptions • The mounts were assumed to be rigid i.e. they hold their form during impact. • The velocities were applied to the entire structure. • The sandwich is modeled as 3 layers with Balsa core encapsulated between • two layers of RTM. • Material was assumed isotropic. The average properties used for analysis were taken from the data provided by A123. • The other assumptions related to bonding are same as they were in the previous work. • The NCAP, Side 50th and Side 5th pulse were evaluated as these were the most severe pulses based on the velocities. • For the remaining pulses there was no information on whether the barrier moves or the car moves and they were at significantly lower velocities (Thus these were not evaluated).
Signed VonMises Stress plot NCAP Baseline The RTM Cover is showing a peak tensile stress of 235 MPa at the corners. The RTM Base is showing a peak stress of (206MPa, -173MPa).The regions with stress above 140 MPa are shown in red.
Signed VonMises Stress plot NCAP Baseline The steel strap is showing a peak stress of (276MPa, -236MPa). The regions with stress above 274 MPa are shown in red.
Signed VonMises Stress plot NCAP Baseline Bolt forces are within the threshold of 8100 N.
Signed VonMises Stress plot Side 5th - Baseline The RTM cover is showing a peak tensile stress of 32 MPa. The RTM Base is showing a global stress of 80 MPa. The areas exceeding 140 MPa would be shown in red.
Signed VonMises Stress plot Side 5th - Baseline The steel strap is showing a peak stress of (270MPa, -248MPa). The areas above 274 MPa would only be in red.
Side 5th - Baseline Bolt forces for two bolts exceed the threshold of 8100 N.
Side 50th - Baseline The RTM cover is showing a peak tensile stress of 32 MPa. The RTM Base is showing a global stress of 80 MPa. The areas exceeding 140 MPa would be shown in red.
Signed VonMises Stress plot Side 50th - Baseline The steel strap is showing a global stress of 300 MPa. The areas above 274 MPa would only be in red.
Side 50th - Baseline Bolt forces are within the threshold of 8100 N.
Observations • The bolt forces exceed the threshold of 8100 in the Side5th pulse. • Stresses for the RTM base are higher than threshold of 140 MPa for Frontal NCAP. These stresses are localized at couple of regions only. • Stresses on the cover are higher than threshold of 140 MPa for Frontal NCAP in two corners only. • Stresses in other places are within the allowable limits.
Design Modifications • In order to improve the load bearing capacity of the floor i.e. to withstand the large forces seen in two bolts, the thickness of the base RTM was increased to 4 mm from baseline thickness of 2 mm. • The thickened results are corresponding to this increased base thickness to 4 mm. • Henceforth, all the thickened designs would refer to the RTM layer with the thickness of 4 mm. • Other pulses would also be run with this thickened floor to evaluate the implication of this change on the composite structure. RTM: 4 mm Balsa: 6 mm RTM: 4 mm RTM: 2 mm Balsa: 6 mm RTM: 2 mm Baseline Design Modified Design: Thickened Base
Modified Design & Recommendation
Signed VonMises Stress plot NCAP-Thickened The RTM cover is showing a peak tensile stress of 234 MPa. The regions with stress above 150 MPa are shown in red. The RTM Base is showing a peak stress of (111MPa, -82MPa)
Signed VonMises Stress plot NCAP-Thickened The cooling pads is showing a peak stress of 134 MPa at the corners. The steel strap is showing a peak stress of (276MPa, -236MPa).The regions with stress above 274 MPa are shown in red.
NCAP - Thickened Bolt forces are within the threshold of 8100 N.
Signed VonMises Stress plot Side 5th – Thickened The stresses in all the components are within permissible limits for the Side 5th pulse with thickened base.
Side 5th – Thickened Bolt forces for all bolts are within the threshold of 8100 N.
Signed VonMises Stress plot Side 50th – Thickened The RTM base is showing a peak tensile stress of 100 MPa. The areas above 140 MPa would be in red. The steel strap is showing a peak stress of (250MPa, -159MPa)
Side 50th – Thickened Bolt forces for all bolts are within the threshold of 8100 N.
Bolt Force Plot Baseline Thickness Base Thickened thk – Base Thickened Bolt forces are within the threshold of 8100 N for thickened base.
Phase IV Observations Observations: 1) The bolt forces for 2 bolts exceed the threshold force with the baseline thickness for the Side 5th pulse. 2) The stresses are within permissible levels for the base of the assembly. 3) The cover shows couple of spots with high stresses and solution to lower those stresses is part of the recommendations. • The stresses in the steel straps are within the permissible levels. Yielding is observed in the steel straps. Update of 12/15/2009
Recommendations • The battery tray using sandwich construction carrying a massive weight of battery stacks needs higher stiffness. This can be achieved by: • Use of more glass content in the composite skin by improving the process or using vacuum or using infusion. • Use of higher density/compressive strength core. • Use alternate material/processes for the skin. • Improving adhesion between the core and the skin. Change to PLIOGRIP 7400 series adhesives which are resistant to exposure to elevated temperatures, moisture, fuel, most solvents and chemicals. An established application pattern should be developed. Additional test data would be needed. • To remove the high stress local spots, we recommend that isolation pads be added to where the steel straps are mounted to the vehicle. • The battery tray holes design for bolts need improved design. This can be achieved by: • Modeling the holes as clearance holes. • Do not have raw balsa exposed in the thru-plane direction at the holes. • Use a compressive sleeve top arrest loading of composite skin. • Compressive sleeve should use an isolator grommet to avoid transferring the vibration. This should address the skin stresses seen in the high stress areas.
Recommendations • 3. The corner high stresses of 234 MPa on the cover could be addressed using local patches of bidirectional fabric of E-Glass or Carbon Fiber along with continuous fiber mat as shown below. These solutions would improve the threshold stress value to 300 MPa. Local patches of 5-in circles at the locations highlighted above