Improving Visualization of Large Hierarchical Clustering
260 likes | 303 Vues
Explore a novel approach, Stacked Trees method, for enhancing visualization of large hierarchical clustering data. Overcome challenges of traditional methods to provide intuitive insights and accessibility to vast datasets.

Improving Visualization of Large Hierarchical Clustering
E N D
Presentation Transcript
Improving Visualization of Large Hierarchical Clustering IV 2012, 16th International Conference on Information Visualisation, pp.220 – 228, Montpellier, France, July 11-13, 2012. Gilles Bisson, Renaud Blanch CNRS, UJF-Grenoble 1 AMA, IIHM teams - LIG Laboratory - UMR 5217 BP 53 - F-38041 Grenoble Cedex 9, France 2014 / 05 / 20M2haseshun
Author • Clustering • Hierarchical Clustering Algorithm • Machine learning • Visualization of the large tree • etc…
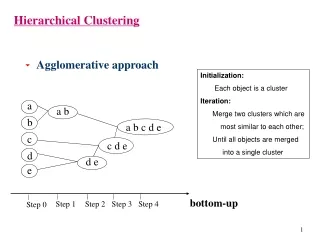
MOTIVATIONS • The Visualization Challenge • Clustering • to understand and to explore large databases • to explore the relationships between instances • Agglomerative Hierarchical Clustering(AHC) • to provide relevant information for analyzing data • an intuitive and interpretable way for human being, namely a binary tree
MOTIVATIONS • The Visualization Challenge • visualization of trees • the number of leaves grows exponentially with the depth of the tree • a dendrogram containing more than a few hundred leaves → becomes unfeasible
MOTIVATIONS • The Visualization Challenge • visualization of large sized trees • display only a subpart of the structure + filtering, distortion, zooming, panning ex)zooming • the user loses his overview of the whole dataset • the exploration needs a training step Providing a static view able to present a large amount of data in a non-ambiguous, uncluttered, scalable way is a worthwhile.
MOTIVATIONS • Application Domain • a chemoinformatics application • to design some new therapeutic molecules (Drug Discovery) • a large set of different molecular structures • some tens or hundreds of active molecules (named hits) • some interactive tools enabling the chemists to ease the search for related
MOTIVATIONS • Application Domain • some interactive tools enabling the chemists to ease the search for related • to identify the relative position of the hits • to look at the position of the hits within the already known families of molecules • to display the shared properties of the hits • to detect unexpected clusters and to analyze • a goal of this paper • the hierarchy structure and visualization being easier for human to understand • to display the many data(instance) • to be able to access the local information and the global information the user must be able to access simultaneously the local information contained in the leaves,and also the global information characterized by the medium and higher levels of the hierarchy
STATE OF THE ART • Visualization in Chemistry • Heat-map • to express a data matrix by color • Self Organizing Maps (SOM) • to express the similarity of input by the distance on a map • Hyperbolic tree • each area represents either a part of the hierarchy or the average values of a set of neighboring objects • Problem • Heat-map, SOM • don’t visualize the hierarchical information • to be able to access only leaves • Hyperbolic tree • the representation is too dense
STATE OF THE ART • Generic Visualization Methods • representation techniques • node-links • the nodes and their relationships : explicitly drawn on the screen • space filling • the relationships between clusters : a set of nested shapes using the full area of the screen. • hybrid • to combine the two previous approaches
STATE OF THE ART • Generic Visualization Methods • node-links • Hyperbolic trees • Cone Tree • 3D representation being able to visualize the number of clusters up to about ten thousand • Space Tree • a dynamic approach in which the parts of the hierarchy are dynamically reconfigured through the folding/unfolding of subtrees. • Problem • There are few clusters which can be displayed (Hyperbolic trees) • The visual clutter by 3D expression occurs (Cone trees) • it is impossible to access the information contained in the leaves without moving within the structure(Space trees)
STATE OF THE ART • Generic Visualization Methods • space filling • TreeMaps • an optimal use of the display space • represented by a sequence of nested rectangles • Problem • the hierarchical structure is quite hard to perceive • the relative position of the blocks is not necessarily very intuitive and requires some practices
STATE OF THE ART • Generic Visualization Methods • hybrid • Elastic Hierarchies • combining a node-link and TreeMaps • interpretability of the hierarchical structure ◯ • compactness of the data ◯ • Problem • the map are smaller • the optimal use requires some training from the user • the criticism about the arbitrary position of the clusters in the TreeMaps remains
THE STACKED TREES VISUALIZATION • Main Principles • Stacked Trees method(The proposed method) • the hybrid representation family • simplifying the learning curve • to access simultaneously to the local information and highest levels of the hierarchy
THE STACKED TREES VISUALIZATION • Main Principles • Stacked Trees method(The proposed method) • stacks • a simplified 1D structure • to organize all the leaves (instances) belonging to a given subtree • allows a dynamic reordering of the instances
THE STACKED TREES VISUALIZATION • Information Density Analysis • compare the number of instances displayed at the same time • screen : 2Mpx(2000px width and 1000px height) • an area of one instance: 16px(4x4)
PRESENTATION OF THE PROTOTYPE • General Organization • the prototype as used in our chemical application • Web application(PHP, Javascript, CSS)
PRESENTATION OF THE PROTOTYPE center : hierarchy right : similarity scale • General Organization a scroll list of the selected stack a collection ofstacks the selected stack a slider allowing an interactive adjustment of the cut level of the hierarchy
PRESENTATION OF THE PROTOTYPE • Visualization of the Features display rules (<feature, selector, value> <position , color>)
PRESENTATION OF THE PROTOTYPE • Visualization of the Features
PRESENTATION OF THE PROTOTYPE • Visualization of the Features
PRESENTATION OF THE PROTOTYPE • Visualization of the Features left cluster : mass is less than 260 (green values) right cluster : mass is more than 300 (red values)
PRESENTATION OF THE PROTOTYPE • Visualization of the Features the most typical molecule of the currently selected stack the selected molecule a list of the “nearest neighbors” of the selected molecule
PRESENTATION OF THE PROTOTYPE • Instance Ordering in the Stacks the menu through which the order of the instances in the stacks can be modified • Sorting by the position of the leaves • Sorting by values • Sorting by typicality • typical instance : the one minimizing the square distance to the others instances • selected instance : • the distance with this one
PRESENTATION OF THE PROTOTYPE • Navigating in the Hierarchy cluster: selected cluster is chosen as the root
PRESENTATION OF THE PROTOTYPE • Navigating in the Hierarchy selected root andadjustment slider cluster: selected cluster is chosen as the root
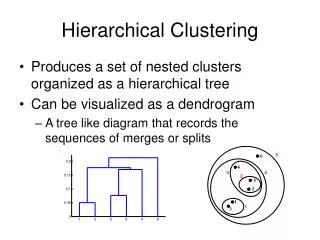
CONCLUSION • Stacked Trees • a new hybrid visualization technique • allows to display and to navigate into large hierarchies, composed of up to 50 000 instances • an advantage • its layout is simple to understand • the density of information is quite high • generic • improvement point • navigation tools(Fisheye view) • representation of stack(a Parallel Coordinates)