Download
1 / 19
190 likes | 295 Vues
Explore the intricacies of Earth's atmospheric circulation models, from single cells to the three-cell model, considering factors like Earth's rotation, land masses, and unequal solar heating. Discover the impact of ocean currents, Coriolis force, and phenomena like ENSO on global weather patterns.

E N D
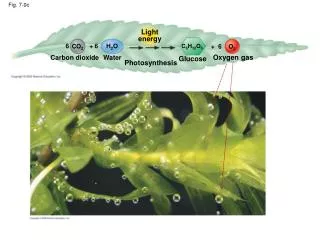
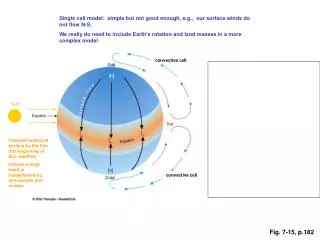
Single cell model: simple but not good enough, e.g., our surface winds do not flow N-S. We really do need to include Earth’s rotation and land masses in a more complex model convective cell sun Unequal heating of surface by the Sun (the beginning of ALL weather). Uneven energy input is redistributed by atmosphere and oceans convective cell Fig. 7-15, p.182
Three cell model: much better, but not perfect. Here we “allow” rotation, but still have ocean-covered planet. Land masses obscure this predicted three-cell pattern. Predicted surface winds after PGF and CF included Must be an odd number of cells: what goes up at beginning of first cell must be “balanced” by what comes down at end of last cell. Could be 1, 3, 5, etc. Three on Earth dictated by rotation speed. On Venus, where rotation is very slow, only one cell develops. Fig. 7-16, p.183
Minot, N. Dakota (48 N) westerlies Tucson, Arizona (32 N) easterlies Fig. 7-15b, p.182
Subpolar low Subtropical high Equatorial low Subtropical high Subpolar low (shows up as a trough, as predicted) Fig. 7-17a, p.184
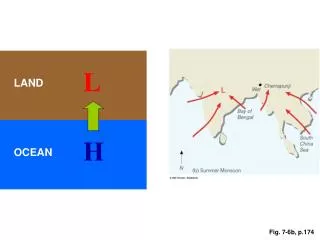
Pacific H has moved N. and W. allowing sinking, warming air to subside along Pacific coast Bermuda H. has moved S. and W. driving air to thermal low over AZ and setting up conditions for monsoons For more about the monsoon see http://www.wrh.noaa.gov/twc/monsoon/monsoon.php Fig. 7-17b, p.185
Elevated inversion due to sinking air from Ferrel cell, which warms as it compresses on the way down to the surface (see Fig. 12.12). Fig. 7-19, p.187
During summer, the eastern edge of the Pacific High is well situated to force sinking warming air down over Los Angeles causing a strong elevated inversion that prevents convection and clouds/rain (see Fig. 7.17b). Fig. 7-20, p.187
Polar low Fig. 7-21, p.187
For us, the following are the most important ocean currents: 1) Gulf Stream 2) North Atlantic Drift 3) Newfoundland Current 9) South Equatorial Current 16) California Current 17) Peru (Humbolt) Current Fig. 7-24, p.190
Cold CA current If the CA current brings cold water down from Alaska then why is the coldest water halfway down the coast and not further north? Answer – upwelling. Fig. 7-25, p.191
Coriolis “force” causes ocean current to deflect to the right, i.e., offshore Upwelling of very cold water from the bottom of the Pacific is evident off San Francisco Fig. 7-26, p.191
ENSO = El Nino/Southern Oscillation (in atmospheric pressure and wind direction) Fig. 7-27, p.193
97/98 El Nino animation: http://www.cdc.noaa.gov/map/clim/sst_olr/old_sst/sst_9798_anim.shtml “Temperature anomaly” scale Current sea surface temperature animation: http://www.cpc.ncep.noaa.gov/products/analysis_monitoring/enso_update/sstanim.html Fig. 7-28, p.194
Very weak ENSO this winter: warmer/wetter conditions to SE AZ Fig. 7-29, p.195