Download

1 / 5
60 likes | 180 Vues
This guide explains the concepts of X and Y intercepts in a graph, where the X-intercept occurs when the graph crosses the X-axis (Y=0) and the Y-intercept occurs when it crosses the Y-axis (X=0). We will calculate the intercepts for three equations: 2x + 7y = 28, -3x + 6y = 12, and x + 2y = 4, and then graph using the intercepts to illustrate the results. This understanding is crucial for visualizing linear equations and their relationships in a coordinate system.

E N D
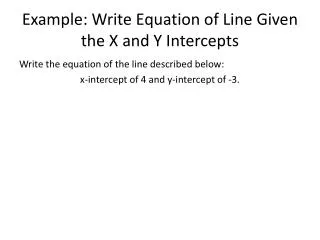
X and Y intercepts • X intercept- where the graph crosses the x-axis, the value for y is always 0. • Y intercept- where the graph crosses the y-axis, the value for x is always 0.
Find the x-intercept and y-intercept of 2x + 7y = 28Graph using the intercepts
Find the x-intercept and y-intercept of -3x + 6y = 12Graph using the intercepts
Find the x-intercept and y-intercept of x + 2y = 4Graph using the intercepts