Investigating Oxygen and Carbon Fluxes in the North Pacific Gyre
This study investigates mechanisms driving CO2 drawdown from subarctic to subtropical gyres, determining oxygen and carbon export processes. In situ measurements and remote sensing data help analyze upper ocean oxygen dynamics. Key findings show net carbon production in subarctic and subtropical zones, highlighting the importance of biological carbon export in the ocean's carbon cycle. Future research aims to develop methods to determine carbon pump remotely for a better understanding of ocean-atmosphere CO2 fluxes.

Investigating Oxygen and Carbon Fluxes in the North Pacific Gyre
E N D
Presentation Transcript
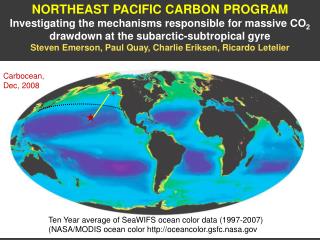
NORTHEAST PACIFIC CARBON PROGRAM Investigating the mechanisms responsible for massive CO2 drawdown at the subarctic-subtropical gyre Steven Emerson, Paul Quay, Charlie Eriksen, Ricardo Letelier Carbocean, Dec, 2008 Ten Year average of SeaWIFS ocean color data (1997-2007)(NASA/MODIS ocean color http://oceancolor.gsfc.nasa.gov
IN SITU MEASUREMENTS OF NET BIOLOGICAL OXYGEN PRODUCTION COLLABORATORS: Roo Nicholson, Charlie Eriksen, Chuck Stump U.W. Meghan Cronin,Chris Sabine, PMEL Mike DeGranpre, U.Montana; Marie Robert IOS, BC, CA Tommy Dickey, HOT Scientists Ten Year average of SeaWIFS ocean color data (1997-2007)(NASA/MODIS ocean color http://oceancolor.gsfc.nasa.gov
GOAL To Determine the Value of Oxygen and Carbon Export form the Ocean Euphotic Zone and the Processes Controlling it X X X X (Laws, 2000, GBC, 14, 1231) (Schlitzer, 2000, Geophys. Mono. 114)
UPPER OCEAN OXYGEN DYNAMICS d[C]/dt = diffusive gas exchange + bubble exchange + diapycnal mixing + isopycnal mixing +biological production
STUDY LOCATIONS AND METHODS The MOSEAN Mooring and Seaglider The Hawaii Ocean Time Series (HOT) 2005-2006 The UW-PMEL Mooring and Seaglider at Stn P (2007 - ) Sensors: CTD-O2-GTD, 10 m Sensors: T, S, O2 Sensors: CTD-O2-GTD, pCO2, pH
Atmosphere &Total Dissolved Gas Pressures in the surface Ocean at HOT & Stn P HOT GTD atmosphere Stn P
Pressure of N2 (pN2) is determined from atmospheric and total dissolved gas pressure, and [O2 ] pN2 = PW,GTD – (PAtm-pH2O)(XAr+XCO2) – pH2O – [O2]/KH,O2 HOT Stn P
Calculation of Net O2 production from O2 and N2 data h(d[O2]/dt) = -Fair-water + dh/dz ([O2,therm –[O2]) + Fpyc + JbioFa-w = Diffusive Exchange + Bubble TransferFa-w = G{[O2,sat] – [O2]} + (Vinj+ VexD0.5α}XO2 G = mass transfer coefficient (Wind Speed)V = Bubble transfer coefficients h = mixed layer depth D= molecular diffusion coef. α = solubility X = atmospheric mole fraction Assume: Vinj= VexDαFpyc = 0 Use N2 to determine V O2 to determine J
Cumulative O2 Production at HOT the important terms in the mass balance Mixed-layer O2 Production = 4.8 ± 2.7 mol m-2 yr-1 (Emerson et al., 2008, GBC)
Oxygen Productivity below the Mixed Layer:T, S, and Oxygen concentration on Sea Glider (Nicholson, Emerson, Eriksen, 2008, L&O 53, 2226 ) NW SW NE SE X Aloha Glider path and mean O2 superaturation Correlation among: SSH, isopycnal depth, [O2] NCP (below the m. l.) =0.9 mol C m-2 yr-1
Summary of Biological O2 Production at HOT and Stn P: from mooring and glider measurements Mixed-layer O2 Production = 4.8 ± 2.7 mol m-2 yr-1 (Emerson et al., 2008) Submixed layer Production = 0.9 ± 0.3 (Nicholson et al., 2008) Flux across the thermocline 0.0 – 0.8 mol m-2 yr-1 (Kz = 0.1-1.0 cm2 s-1) Biological O2 Production = 6.1 ± 3.1 mol m-2 yr-1 HOT: Net Biological C Production = 4.2 mol C m-2 yr-1 STN P: Net Biological C Production = 2.3 mol C m-2 yr-1 HOT STA P
CONCLUSION: O2 and Organic C export is at least as great at Hot as it is at Stn P – Satellite Export is uncalibrated! mol C m-2 yr-1 2.3 4.2
The Role of CaCO3 and Organic Matter Production in DIC Change [CO32-] calculated pH and pCO2 at Stn P pH = 8.10, pCO2 = 400 ppm pCO2 pH [CO3] increases by ~25 mol kg-1 in summer pH = 8.05, pCO2 =350 ppm pCO2 Chris Sabine pH Steve Emerson and Mike deGranpre
Calculating the fraction of the DIC Change that is due to CaCO3 formation and O.M. formation (1) ΔDIC =ΔDIC(om) + ΔDIC(CaCO3) (2) ΔAlk = ΔAlk (om) + ΔAlk(CaCO3) (3) ΔDIC(om) = ΔO2 rDIC:O2 = ΔO2 (-106/154) (4) ΔAlk(om) = ΔO2 rAlk:O2 = ΔO2 (16/154) (5) 2 ΔDIC(CaCO3) = ΔAlk(CaCO3) (6) ΔAlk - ΔDIC = 25 μmol kg-1 Combining these equations gives: ΔDIC (CaCO3) / ΔDIC (om) = 1.4 [CO3] increases by ~25 mol kg-1 in summer (3) RESULTS: O2 AND N2 SUPERSATURATION IN THE MIXEDLAYER
CONCLUSIONS 1. It is possible to determine the major components of the carbon fluxes remotely using presently available in situ sensors 2 . Net Oxygen (Organic Carbon) Production in the subtropical North Pacific is ≥ that in the subarctic Pacific which meaning that models and satellite color predictions are not yet correct. 3. Net Carbon Production HOT (subtropical) NCP = 4.2 mol C m-2 yr-1 Stn P (subarctic) NCP = 5.5 ncp (o.m.) = 2.3 ncp (CaCO3) = 3.2
THE FUTURE (A) A Global distribution of moorings and sensors
Can We Develop Methods of Determining the Net Annual Biological Carbon Pump Remotely?(Both organic carbon and CaCO3!)
GLOBALGOAL: To Understand the Importance of Biological Carbon Export in Determining the Ocean-Atmosphere Flux of CO2 For Example: There is presently a discrepancy between annual carbon export determined by O2 mass balance and that predicted by satellite color X X X X X 1 3 10 30 Net Carbon Export (mol C m-2 yr-1) Laws et al., 2000
Improve the Calibration of Model-Determined Productivity and Carbon Export X X Models also predict more carbon export in upwelling areas and less in the open ocean (Schlitzer, 1999) X X X X X