Download
1 / 20
200 likes | 305 Vues
The Comparison of European Countries on the Base Human Development Index. Zlata Sojková, Zlata Kropková Slovak University of Agriculture, Nitra, Slovak Republic.

E N D
The Comparison of European Countries on the Base Human Development Index Zlata Sojková, Zlata Kropková Slovak University of Agriculture, Nitra, Slovak Republic
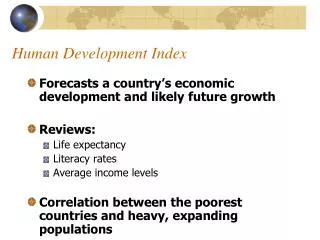
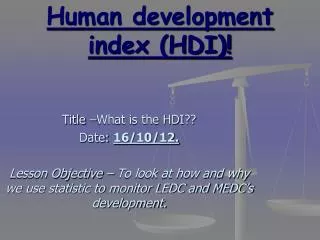
The human development index is one of the important indicators of country development level, including another aspect concerning the quality of life unlike gross domestic product. • The countries are categorized to three categories by The United Nations Organization Development Program (UNDP) according to the Human development index: low level of human development to 0.499, middle level from 0.500 to 0.799, and high level from 0.8 to 1. • This classification serves as a comparison of the countries of the world with evident marked disproportions between developed and developing countries. • European countries are classified on the basis of this classification into two groups: the countries with high level of Human Development Index and those of middle level.
The aims of the analyses are: • to realize detailed classification of European countries to the groups on the basis of Education Index, Gross Domestic Product Index, and Life Expectancy Index; • to characterize and compare groups of the countries from the point of view of partial indicators creating the Human Development Index; • to specify disparities between countries from the point of view of the partial components of the Human Development Index; • to compare the results of the grouping according to the multidimensional classification with the results of the ranking based on the Human Development Index.
The comparative analysis is realized on the basis of the data from the World Bank in 2002. The following information of 37 European countries was excerpted from these data: • Human Development Index(HDi) • Life Expectancy Index(iLE) • Education Index(iED) • Gross Domestic Product Index(iGDP) • The applied methodological means of multidimensional classification of such countries from the point of view of three components of the HDI is the cluster analysis and the discriminant analysis.
The multidimensional classification of 37 European countries is realized according to the three above mentioned components of the Human Development Index simultaneously: • Gross Domestic Product Index (x1), • Life Expectancy Index (x2) • and Education Index (x3).
Comparison of the European countries from the point of view of the Human Development Index in 2002 Source: HDR 2004 and authors’ calculations*)
Multidimensional classification of European countries in 2002 • The multidimensional classification of countries is realized on the basis of three partial indices (iLE, iED, iGDP). • The countries are grouped to mutual similar six cluster from according to the three indices mentioned above, so that the classified countries were the most similar and there were the significant differences between the clusters. • The Further Neighbour Method is applied in the procedure of agglomeration. • The procedure of classification is presented in dendogram Graph 1. The results of the grouping of European countries are six clusters - groups. • The efficiency of the classification was verified by discriminant analysis and it was confirmed. • The rearrangement within the clusters was not necessary.
Graph 1 Clustering of countries on the basis of partial indices – dendogram Source: HDR 2004 and authors’ calculations*)
The following clusters of European countries were created by multidimensional classification: Cluster 1 (17): Norway, Sweden, Netherlands, Belgium, Island, Ireland, Switzerland, United Kingdom, Finland, Austria, France, Denmark, Germany, Spain, Greece, Portugal, Slovenia Cluster 2 (4):Luxemburg, Italy, Cyprus, Malta Cluster 3 (3):Czech Republic, Slovak Republic, Croatia Cluster 4 (5):Estonia, Poland, Hungary, Latvia, Lithuania Cluster 5 (5):Bulgaria, Albania, Macedonia, Romania, Bosnia and Herzegovina Cluster 6 (3):Russia, Belarus, Ukraine
Geographical clustering of multidimensional classification of European countries in 2002 Source: HDR 2004 and authors’ calculations*)
Comparison of the first and the second cluster on the basis of partial indices
Comparison of the second and the third cluster on the basis of partial indices
Comparison of the third and the fourth cluster on the basis of partial indices
Comparison of partial indices of Human Development Index in the selected countries in 2002
Cluster Scatterplot Cluster Scatterplot Furthest Neighbor Method,Squared Euclidean Furthest Neighbor Method,Squared Euclidean 0,97 Cluster 1 Cluster 1 1 0,93 2 0,96 2 0,89 3 3 4 0,92 4 0,85 iEDU ILE 5 5 0,81 6 0,88 6 Centroids Centroids 0,77 0,84 0,73 0,69 0,8 0,65 0,75 0,85 0,95 1,05 0,6 0,7 0,8 0,9 1 IHDP i HDP Relationship between GDP index and Life Expectancy index and GDP index and Education index in 2002 • It is evident in the graphic picture that the real Gross Domestic Product level expressed in GDP Index is impacted on Life expectancy Index (clusters are charted on the diagonal). • On the other hand the education level expressed in the Education Index almost does not correspond with GDP Index. The clusters of the European countries are separated and are not concentrated on the diagonal. Source: HDR 2004 and authors’ calculations*) Source: HDR 2004 and authors’ calculations*)
It could be submitted, that a real Gross Domestic Product is not significantly determinate for Education level. • This fact is typical for Estonia, Latvia, Lithuania, and the other countries, too. The relatively higher Education Index is attainedin spite of low real Gross Domestic Product.
CONCLUSION • The reason of the application of the multidimensional classification is the fact, that the disparities in partial indices of three indicators composing HDI are averaged by the Human Development Index. • To simplify: Two countries close or identical from the point of view of the total HDI can be less or more evidently different from the point of view of partial indices. From the point of view of the components, the disproportions between countries are covered by the Human Development Index. • Regional disparities within European countries are and will be the next problem of globalization. They might be observed not only in the original European Union, but also particularly in the new Member States.
The investigation of convergence and divergence tendencies and the disparities on the NUTS2 and NUT3 level is just the topic high on the list of our scientific research.