Download

1 / 69
690 likes | 820 Vues
This resource delves into the core concepts of functions and patterns, highlighting the relationship between input/output tables, coordinate planes, and graphical representation. Learn about the definitions of relations and functions, the importance of the vertical line test, and how to create mapping diagrams. Discover how to formulate function rules, evaluate expressions, and recognize patterns in various contexts, from geometric figures to linear graphs. With practical examples and clear explanations, this guide provides a comprehensive understanding of mathematical functions.

E N D
Functions and Patternsby Lauren McCluskey Exploring the connection between input / output tables, patterns, and functions…
Credits • Function Rules by Christine Berg • Algebra I from Prentice Hall, Pearson Education • The Coordinate Plane by Christine Berg
Relation According to Prentice Hall: “A relation is a set of ordered pairs.” Or A relation is a set of input (x) and output (y) numbers.
Function According to Prentice Hall: “A function is a relation that assigns exactly one value in the range (y) to each value in the domain (x).”
Functions • What does this mean? • It means that for every input value there is only one output value.
More on that later, but first let’s review coordinate planes…
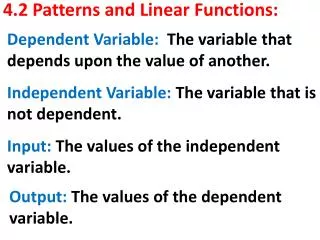
The Coordinate Plane • “You can use a graph to show the relationship between two variables…. When one variable depends on another, show the dependent quantity on the vertical axis (y).” Prentice Hall • Always show time on the horizontal axis (x), because it is an independent variable.
Remember: • The x-axis is a horizontal number line. • It is positive to the right and negative to the left. - + The Coordinate Plane by Christine Berg
+ Y-axis • The y-axis is a vertical number line. • It is positive upward and negative downward. - The Coordinate Plane by Christine Berg
Origin • The origin is where the x and y axes intersect. This is (0, 0). (0, 0) The Coordinate Plane by Christine Berg
Quadrants The x and y axes divide the coordinate plane into 4 parts called quadrants. I II III IV The Coordinate Plane by Christine Berg
Ordered Pair A pair of numbers (x , y) assigned to a point on the coordinate plane. The Coordinate Plane by Christine Berg
Tests for Functions: • “One way you can tell whether a relation is a function is to analyze the graph of the relation using the vertical-line test. If any vertical line passes through more than one point of the graph, the relation is not a function.” Prentice Hall
Vertical-Line Test This is a function because a vertical line hits it only once.
Function Tests: • “Another way you can tell whether a relation is a function is by making a mapping diagram. List the domain values and the range values in order. Draw arrows from the domain values to their range values.” Prentice Hall
Mapping Diagram • (0, -6), (4, 0), (2, -3), (6, 3) are all points on the previous graph. List all of the domain to the left; all of the range to the right (in order): Domain: Range: 0 -6 2 -3 4 0 6 3
Mapping Diagram Then draw lines between the coordinates. Domain: Range: 0 -6 2 -3 4 0 6 3 • If there are no values in the domain that have more than one arrow linking them to values in the range, then it is a function. • So this is a function.
Function Notation f(x) = 3x + 5 Output Input Function Rules by Christine Berg
Function Function Notation: f(x) = 3x + 5 Rule for Function Function Rules by Christine Berg
Function Set up a table using the rule: f(x)= 3x+5 Function Rules by Christine Berg
Function Evaluate this rule for these x values: f(x)= 3x+5 So 3(2) + 5 = 11… Function Rules by Christine Berg
Functions • “You can model functions using rules, tables, and graphs.” Prentice Hall • Each one shows the relationship from a different perspective. A table shows the input / output numbers, a graph is a visual representation, a function rule is concise and easy to use.
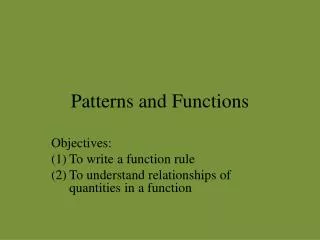
Patterns Patterns are functions. They’re predictable. Patterns may be seen in: • Geometric Figures • Numbers in Tables • Numbers in Real-life Situations • Linear Graphs • Sequences of Numbers
Patterns with Triangles • Jian made some designs using equilateral triangles, as shown below. He noticed that as he added new triangles, there was a relationship between n, the number of triangles, and p, the outer perimeter of the design. P= 4 P=6 P=3 P=5 from the MCAS
P = 6 P = 4 P = 3 P = 5 Number ofTrianglesOuter Perimeter (in units)1 3 2 4 3 5 4 6 ... …N p from the MCAS
Triangles P= 4 P= 6 * Write a rule for finding p, the outer perimeter for a design that uses n triangles. P = 3 P = 5 P= 3 P= 5 from the MCAS
How to Write a Rule: • Make a table. • Find the constant difference. • Multiply the constant difference by the term number (x). • Add or subtract some number in order to get y. • Check your rule for at least 3 values of x. *Does it work?
P=4 P= 6 P=3 P=5 # ofTrianglesOuter Perimeter (in units) 1 3 (+1) 2 4 (+1+1) 3 5 (+1+1+1) **The constant difference is +1. So multiply x by 1 then add 2 to get the output number. from the MCAS
P = 6 P= 4 P = 3 P = 5 f(x)= X + 2 So evaluate and you get: 2+1= 3; 2+2 = 4; and 3+2 = 5. It works!
Brick Walls Now you try one: What’s my rule? from the MCAS
How to Write a Rule: • Make a table. • Find the constant difference. • Multiply the constant difference by the term number (x). • Add or subtract some number in order to get y. • Check your rule for at least 3 values of x. *Does it work?
Steps The constant difference is +6, so the rule is 6x + 1.
6 blocks 6 blocks 6 blocks 6 blocks 6 blocks 6 blocks Steps • You can see the constant difference. You’re adding 6 blocks each time.
Square Tiles • The first four figures in a pattern are shown below. * What’s my rule? from the MCAS
How to Write a Rule: • Make a table. • Find the constant difference. • Multiply the constant difference by the term number (x). • Add or subtract some number in order to get y. • Check your rule for at least 3 values of x. *Does it work?
+4 blue +4 red +4 green +4 corners Square Tiles The constant difference is +4 so the rule is 4x + 4.
+ 4 blue + 4 red + 4 green etc… + 4 corners Square Tiles • You can see this: +4 blue +4 red +4 green
Extending Patterns in Tables Based on the pattern in the input-output table below, what is the value of y when x = 4? from the MCAS
How to Write a Rule: • Make a table. • Find the constant difference. • Multiply the constant difference by the term number (x). • Add or subtract some number in order to get y. • Check your rule for at least 3 values of x. *Does it work?
Extending Patterns in Tables Based on the pattern in the input-output table below, what is the value of y when x = 4? from the MCAS
Patterns in Tables A city planner created the table on the next slide to show the total number of seats for different numbers of subway cars. • What is the rule? from the MCAS
How to Write a Rule: • Make a table. • Find the constant difference. • Multiply the constant difference by the term number (x). • Add or subtract some number in order to get y. • Check your rule for at least 3 values of x. *Does it work?
Subway Cars First, make a table… from the MCAS
Subway Cars f(x) = 30x
Try it! • Write a rule that describes the relationship between the input (x) and the output (y) in the table below. from the MCAS
How to Write a Rule: • Make a table. • Find the constant difference. • Multiply the constant difference by the term number (x). • Add or subtract some number in order to get y. • Check your rule for at least 3 values of x. *Does it work?
Input / Output Table • f(x)=2x + 1
Patterns in Real-life Situations • Lucinda earns $20 each week. She spends $5 each week and saves the rest. The table below shows the total amount that she saved at the end of each week for 4 weeks. • What’s the rule? from the MCAS
How to Write a Rule: • Make a table. • Find the constant difference. • Multiply the constant difference by the term number (x). • Add or subtract some number in order to get y. • Check your rule for at least 3 values of x. *Does it work?