4.2 Patterns and Linear Functions:
Dependent Variable: The variable that depends upon the value of another. 4.2 Patterns and Linear Functions:. Independent Variable: The variable that is not dependent. . Input: The values of the independent variable. Output: The values of the dependent variable.

4.2 Patterns and Linear Functions:
E N D
Presentation Transcript
Dependent Variable: The variable that depends upon the value of another. 4.2 Patterns and Linear Functions: Independent Variable: The variable that is not dependent. Input: The values of the independent variable. Output: The values of the dependent variable.
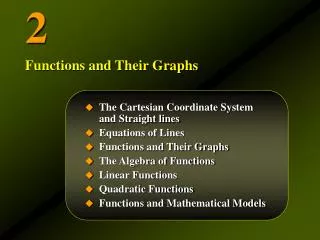
Function f(x): A relationship that pairs one input to exactly one output (x, y) Linear Function: A function whose graph is a nonvertical line or part of a nonvertical line.
In math we use tables, words, equations, set of ordered pairs and graphs to represent a relationship between two variables. This can be done when we are presented with the following: 1. Geometric Relationships, 2. Linear Functions
GEOMETRIC RELATIONSHIPS: Ex: Use words, an equation, a table and a graph to represent the relationship between the number of rectangles and the perimeter of the figure.
Words: Look at the figure, multiply the number of rectangles by 2 to get the total lengths of the top an bottom sides of the combined figure. Then add 2 times the length of the left and right sides of the combined figure to obtain the final answer for the total perimeter of the figure.
Equation: Look at the figure: We must realize that the only thing that is changing is the number of the short side (width). Also, the number of the length is constant which is = 12. Using this info we see that the equation is: y or f(x) = twice the number of short + twice the length. f(x) = 2x + 12
Table: Looking at the figures we see that: X = number of rectangles (independent)y = Perimeter of the figure (depends on figure)
Graph: 22 20 18 Perimeter 16 14 12 10 8 6 4 2 1 4 2 3 5 Figure
YOU TRY IT: Use one method to represent the relationship between the number of triangles and the perimeter. 1 1 1 1 1 1 1 1 1 1 1 1
Words: Triangles = 1 Perimeter = 3 1 1 1 1 Triangles = 2 Perimeter = 4 1 1 1 1 1 1 Triangles = 3 Perimeter = 5 1 1 Look at the figure, The perimeter is 2 more than the number of triangles.
Equation: Again, the perimeter [ y or f(x)] is 2 more than the number of triangles (x) y = x + 2 f(x) = x + 2
Table: Looking at the figures we see that: X = number of rectangles (independent)y = Perimeter of the figure (depends on figure)
Graph: 10 9 Perimeter 8 7 6 5 4 3 2 1 1 4 2 3 5 Figure Q: What is the value of y if x = 0?
LINEAR FUNCTIONS:Data from a table can be scrutinize to see if it is a linear relation. In order for us to make the final decision, we first must see how the y – function, changes for each x in the table. Ex: Is there a linear relation in this table?
To answer the question we must take a look at what is happening in the table. + 1 + 1 + 1 - 3 - 3 - 3 The starting memory is 512 MG The independent variable x increases by 1 The dependent variable y decreases by 3
Taking the info to consideration, we can see that the equation for the problem is: + 1 + 1 + 1 - 3 - 3 - 3 y = 512 – 3x The dependent variable y decreases by 3
YOU TRY IT: For the table, determine whether the relationship is a linear function. Then represent the relationship using words, an equation and a graph.
YOU TRY IT: (SOLUTION) Looking at both variables, we have: +8 +1 +8 +1 +8 +1 Both, the x and y are changing at a constant rate.
YOU TRY IT: (Words Solution): A person had 10 dollars and then starts a job where he earns eight dollars per hour.
YOU TRY IT: (Equation Solution): We started with 10 dollars and earn 8 after each hour. y = 8x + 10 f(x) = 8x + 10
YOU TRY IT: (Graph Solution) 35 30 Money $ 25 20 15 10 5 1 2 3 Hours Q: What will the total money after 4 hrs?.
VIDEOS: Linear Functions https://www.khanacademy.org/math/algebra/linear-equations-and-inequalitie/analyzing-functions-algebra/v/constructing-a-linear-function-word-problem https://www.khanacademy.org/math/algebra/linear-equations-and-inequalitie/analyzing-functions-algebra/v/constructing-and-interpreting-a-linear-function
CLASS WORK: Pages: 243 – 245 Problems: As many as it takes to master the concept.
CLASSWORK:Page 243-245 Problems: 5, 7, 9, 11, 12, 13, 14, 16, Review Handout