Download
1 / 72
720 likes | 875 Vues
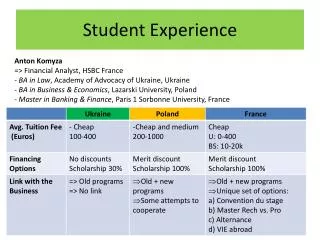
2008 International Student Experience Survey. MGMT 510/MIM 535 Global Market Research. Our Team. Joel Alley Kapil Desai Ryan Felsheim Jeffrey Goddard Aaron Lisle Ali Malak Jeffrey Rourke Kristine Sarreal Damanbir Singh. Agenda. Introduction Section I: Situational Assessment

E N D
2008 International Student Experience Survey MGMT 510/MIM 535 Global Market Research
Our Team Joel Alley Kapil Desai Ryan Felsheim Jeffrey Goddard Aaron Lisle Ali Malak Jeffrey Rourke Kristine Sarreal Damanbir Singh
Agenda Introduction Section I: Situational Assessment Responder Analysis Content Analysis COO Analysis Section II: Admissions Performance Section III: ISSS Performance Section IV: PSU Overall Performance
Study Purpose Admissions Evaluate recruiting process and marketing material Involvement in decision making process Other universities applied to What is behind the decision not to come to PSU once accepted Service quality perceptions and satisfaction with international admissions process
Study Purpose • International Student Services and Scholarship • Degree ISSS impact international student retention • ISSS services utilized • Transferring students • Perception of ISSS service quality
Study Design • First Stage: Exploratory • Preliminary research • Interviews • Second Stage: Pre-test • Final Stage: Survey and analysis of results
Enrollment Are you currently enrolled at PSU? Overwhelming majority of respondents are current PSU students
Other School Choices Arizona State University University of Maryland-College Park Louisiana Tech University University of North Carolina-Charlotte University of Utah Seattle University University of Toledo University of Texas at San Antonio Kansai Gaidai Lulea university of technology San Jose State University
Intention to Complete Studies at PSU Do you intend to complete you studies at PSU? Majority of students intend to complete their studies here
Transfer • East Coast • Back home; was only here for an Exchange Program • Back home; Waseda University • University of Minnesota, Twin Cities • Western Washington University • A better college that’s worth the money I’m spending; UC Irvine or UC Berkley
Responder Analysis The term responder analysis here refers to the characteristics of the respondents or students who took the survey like sex, nationality, age, academic level, school they are enrolled in etc.
Responder Analysis Who responded by country? 195 responses, 63 missing, biggest country represented: Saudi Arabia.
Responder Analysis Is sample representative of nationalities? There is no significant difference between students who responded and the larger population in terms of nationalities represented
Responder Analysis Is sample representative of academic levels? There is no significant difference between students who responded to the survey and those in PSU in academic levels (grad/undergrad)
Responder Analysis Gender Majority of respondents were male
Responder Analysis Age Majority of respondents 18-24 years old
Responder Analysis Majority of undergrad students from Saudi Arabia, China, Japan Majority of grad students from India, China, Thailand
Responder Analysis Schools/Colleges Majority of students in SBA, Engineering, Liberal arts schools.
Marketing Communication Content Analysis & Feedback
Content Analysis: Web Dominant Message: Basic description of the campus • 3 references to school size (enrollment) • 3 references to international student population • 3 references to urban location
Content Analysis:Printed Materials • Dominant Messages: • • Portland and surrounding area • • Programs and accolades • Weaker Messages: • Visa & Immigration • Facilities
Involvement in Decision Making Who was involved in helping you make the decision to come to PSU?
Information Source and Decision Which of these information sources was the most important to you in your decision to come to PSU?
Reason for Choosing PSU
Content Analysis: Web • Recommendations: • Website is being underutilized • Website is cited as the most important source of information for students considering PSU • Google web search optimization (AdWords strategy) • Specific Content • Website should have more information about academic programs and other opportunities • Content for Portland & Region and Advising and Assistance seems appropriate • Eliminate discussion of language requirements; may send wrong message
Content Analysis: Printed Materials • Dominant Messages • PSU has a excellent location in the city of the Portland the surrounding area. • PSU has received accolades for it’s strong programs & faculty • Recommendations: • Continue to focus on programs offered and academics • Continue to emphasize location and regional attributes • Reevaluate spending for marketing materials (less print more web)
COO Analysis Service Quality Measures: Reliability (performing the promised service dependably and accurately) Assurance (knowledge and courtesy of the employees and their ability to convey trust and confidence) Tangibles (physical facilities, personnel, website) Empathy (caring, individual attention the firm provides its customer) Responsiveness (willingness to help customers and provide prompt service) Means analysis: Compare the means of the variables across countries to see if there is a significant effect to the country of origin, and from last year’s survey results to this year’s
COO Analysis Admissions Service Quality Significant effects of Country of Origin on perception of admissions reliability and responsiveness.
COO Analysis ISSS Service Quality: No significant effects of country of origin on the perception of service quality for ISSS Japanese students: Tried to identify why Japanese students are unhappy with admissions, and the responses indicate that they are actually unhappy with ISSS “Insurance process and information providing is extremely slow and disorganized. The most need for the insurance for international students is the daily care (flu, cold, allergy,; etc) …” “Set up fast rules that any employee at International Student Service will lose the job if he or she don't meet students' expectations. Then they will start paying attention seriously, and WILLINGLY, PROACTIVELY and ACTIVELY…”
COO Analysis Quality perception: Q46: Overall, I feel like I have received a high quality education at PSU No significant COO effects on quality Means for quality increased from last year
COO Analysis Value perception: Q47: My education at PSU has been a good value for the money No significant COO effects on value perception Means for value increased from last year
COO Analysis Satisfaction: Q48: How satisfied with the PSU experience overall? No significant COO effects on satisfaction Means for satisfaction decreased from last year
Net Promoters and Detractors Q49: Based on your experience in general, would you recommend this university to family, friends, or colleagues? This is a measure of loyalty which influences buying decisions No significant COO effects on willingness to recommend means
COO Analysis Promoters vs. detractors (by country) • No promoters from Japan • Biggest percentage of detractors from India
Net Promoters & Detractors Last three years: • Promoters increased from last year by 2% • Detractors decreased from last year by 11% • Indifference increased from last year by 10%
Net Promoters & Detractors Focus on why Japanese and Indian students are unhappy with PSU This measure is very important because we’ve identified that recommendation of friends and family is what brought about half of international students here (47 %)
Admissions Staff Reliability … the core of any service, reflecting an organization’s ability to deliver on their service promise. PSU Admissions was faster at processing my I-20 form than other Universities I applied to. PSU Admissions staff understood the international student application process When the Admissions staff promised to do something by a certain time, they did so. The PSU Admissions office performs services right the first time.
Admissions Tangibles … the physical manifestations of an intangible service • The PSU Admissions website is easy to use. • The PSU Admissions website provided all the relevant information necessary to complete the application process.
Admissions Staff Assurance … a willingness to trust service employees based on demonstrated competence and courtesy • The PSU Admissions staff has the knowledge to answer my questions. • PSU Admissions staff are consistently friendly and polite.
Admissions Staff Empathy … Caring and individual attention, ensuring personal needs are understood and met. I received individualized attention from the staff working in the PSU Admissions office. The PSU Admissions staff understood my specific needs.
Admissions Staff Responsiveness … providing prompt service to individual needs • Employees in the PSU Admissions Office are always willing to help • The PSU Admissions staff gives prompt service.
Admissions Satisfaction A large majority (75.4%) answered that they were Somewhat Satisfied or Extremely Satisfied. Only 10.4% answered that they were Somewhat Dissatisfied or Extremely Dissatisfied.
Admissions Satisfaction: Predictive Findings • Admissions Reliability, Empathy, and Admissions Satisfaction: • The two significant predictors are Reliability and Empathy, with the most significant factor being Reliability: • ADM Reliable B=.55 • ADM Empathy B=.186 • This is a very strong predictor with over half of the Satisfaction attribute affected. • (R2 = .68) ADM Tangible ADM Reliable n.s. B = .55 (p = .000) ADM Responsive Admissions Satisfaction (R2 - .68) n.s. ADM Assure n.s. n.s. COOCODE B = .186 (p = .045) ADM Empathy
ISSS Services Utilized Q28 - The following is a list of services provided by the PSU International Student Services Office. Which service is the single most important student service you have used?