D- ARTERIAL BLOOD GAS ANALYSIS
870 likes | 1.4k Vues
D- ARTERIAL BLOOD GAS ANALYSIS. Arterial Blood Gas Analysis. Description acid-base status oxygenation status Indications Clinical Significance. Indications. Diagnosis Clinical Monitoring Effect of Changes in Therapy. Acid - Base Balance. pH PaCO2 HCO3- Base excess. pH. Definition

D- ARTERIAL BLOOD GAS ANALYSIS
E N D
Presentation Transcript
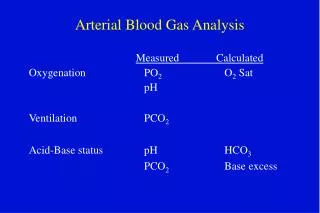
Arterial Blood Gas Analysis • Description • acid-base status • oxygenation status • Indications • Clinical Significance
Indications • Diagnosis • Clinical Monitoring • Effect of Changes in Therapy
Acid - Base Balance • pH • PaCO2 • HCO3- • Base excess
pH • Definition • Acid and Alkaline Balance • ratio of acid to base • Biological and Chemical Significance • Homeostasis • Normal Range
pH defined • free hydrogen ion concentration in a solution • acidity or alkalinity of a substance • pH scale • interaction between: • Lungs exhaling CO2 • Kidneys retaining HCO3- • Kidneys excreting H+ • Organic buffer substances
Henderson - Hasselbalch Equation • pH = pk + log HCO3- / PCO2 x 0.03 • pH = 6.01 + log HCO3- / PCO2 x 0.03 • pH = Kidney / Lung
Physiologic Significance • pH is the interaction of the kidneys retaining bicarbonate/excreting H+ and the lungs excreting CO2 expressed in logarithmic form • pK is a constant representing other factors such as temperature and enzyme activity
Biochemical activity • to maintain a state of health the body relies on thousands of chemical reactions • these reactions need certain conditions to work correctly • pH is the prominent factor that impacts the environment these reactions need to work
Homeostasis • Defined as a state of wellbeing • Keeps the organism (cells) alive and in good health • Alterations cause malfunctions, disease or death of the organism
Normal Range ACID ALKALINE 7.35 to 7.45
Carbon Dioxide • Cellular Metabolism • Hydrolysis of CO2 • H2CO3 • CO2 Transport • Normal Levels
Cellular Metabolism • Chemical reactions responsible for energy • Aerobic Metabolism • End products
Hydrolysis of CO2 • CO2 + H2O H2CO3 H+ + HCO3- • Carbon dioxide reacts with water to form carbonic acid, which further breaks down to form hydrogen ions plus bicarbonate. • This reaction is reversible , bicarbonate can pick up a hydrogen ion to form carbonic acid, which can continue to break down with CO2 and water as the product
Hydrolysis of CO2 and the law of Mass action • According to the law of mass action, a chemical reaction will go in the direction away from the side with the most reactants. • If bicarbonate levels are the heaviest then a H+ ion will be reacted with and the formula will proceed in the opposite direction. HCO3- + H+ H2CO3 H2O + CO2
CO2 Transport in Blood • Plasma • carbamino compounds • HCO3- • dissolved CO2 • Red Blood Cell • carbaminohemoglobin • dissolved CO2 • HCO3-
CO2 transport in plasma • Approximately 10% of all CO2 in blood • carbamino compounds • dissolved in plasma • HCO3-
CO2 transport in the RBC • Approximately 90% of CO2 transported • carbaminohemoglobin • dissolved in plasma inside the erythrocyte • HCO3- • the majority of CO2 is transported as HCO3- in this case because of the presence of carbonic anhydrase in the RBC
Normal Levels in Arterial Blood • CO2 diffuses out of pulmonary capillary blood into the alveoli and is exhaled out of the lungs during the process of ventilation. • As such, Normal levels of PaCO2 reflect adequate alveolar ventilation.
The Normal range of PaCO2 35 mmHg - 45 mmHg
Bicarbonate • Metabolic representation of acid base balance • May reflect the addition of fixed acids or a drop in bicarb levels • Base Excess • Anion Gap • Normal levels
Metabolic Representation of Acid Base balance • Fixed (non volatile acids) • HCO3- being excreted due to kidney malfunction • Both of these conditions reflect the metabolic (renal) contribution to acid-base regulation
Base Excess • A number reflecting all the buffer systems of the body • Can reflect an addition or deficit • Useful for the formula to determine how much Sodium Bicarbonate to administer to bring the pH to normal levels
Anion Gap • Metabolic acidosis • Calculation • Hyperchloremic acidosis • Hypokalemic alkalosis • Normal value
Normal Values Bicarbonate 22 to 26 Base excess –2 to +2
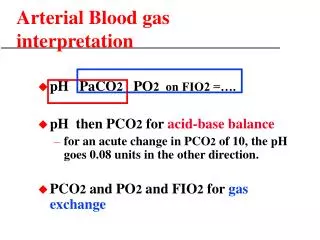
Blood Gas Interpretation • Analyze the pH • Respiratory component • Metabolic component • Assess for compensation
Acidemia • Causes • PaCO2increases (> 45 torr) • HCO3-decreases (< 22 mEq/L) • pH decreases (< 7.35)
Acidemia A patient is in full cardiopulmonary arrest. Blood gases taken during CPR show the following: • pH 7.15 • PaCO2 60 torr • HCO3- 18 mEq/L • BE - 6
Respiratory Acidosis • Causes (acute) • PaCO2 increases (> 45 torr) • pH decreases (>7.45)
Respiratory Acidosis A patient is brought into ER by paramedics. They report that the patient went into respiratory arrest as they entered the hospital parking lot. ABG results follow: • pH 7.28 • PaCO2 56 torr • HCO3- 24 mEq/L
Metabolic Acidosis • Causes • HCO3- decreases (< 22 mEq/L) • Base excess decreases ( - 2) • pH decreases (> 7.45)
Metabolic Acidosis A mechanically ventilated patient is going into kidney failure. ABG results are as follows: pH 7.28 PaCO2 40 torr HCO3- 16 mEq/L
Metabolic Alkalosis • Causes • HCO3- increased (> 26 mEq/L) • Base excess increased (> + 2) • pH increases (> 7.45)
Metabolic Alkalosis A patient in ICU has a sodium bicarbonate drip via IV. The physician writes an order for ABGs to monitor the medication. ABG results are: • pH 7.51 • PaCO2 43 torr • HCO3- 36 mEq/L
Compensation • Compensated respiratory acidosis • PaCO2 > 45 torr • pH < 7.40 (7.35 to 7.39) • HCO3- shows an increase > 26 mEq/L
Compensated Respiratory Acidosis A patient with a long standing history of COPD has the following blood gas results: • pH 7.37 • PaCO2 53 torr • HCO3- 34 mEq/L • BE + 7
Compensated Respiratory Alkalosis A patient with a brain lesion is being treated in the ICU. The patient chronically hyperventilates due to the location of the brain damage. No sedation can be ordered because of the patient’s neural status. ABG results follow: • pH 7.44 • PaCO2 30 • HCO3- 20 • BE - 3
Compensated Metabolic Alkalosis A patient from a nursing home is admitted to the hospital for dehydration and chronic diarrhea secondary to a bacterial infection in the lower GI tract. ABGs are as follows: • pH 7.46 • PaCO2 49 • HCO3- 30 • BE + 8
Partially Compensated Acid-Base Balance • Respiratory component and metabolic component follow the same pattern as with fully compensated acid-base states …… • But, the pH does not fall into normal range!
Partially Compensated Acid-Base Balance • Partially compensated respiratory acidosis • pH 7.32 • PCO2 58 torr • HCO3- 28 mEq/L • Partially compensated metabolic alkalosis • pH 7.32 • PCO2 26 torr • HCO3- 18 mEq/L
Compensated Metabolic acidosis A patient arrives at the ER in a diabetic coma. The patient is exhibiting signs of Kussmaul respirations. ABGs are as follow: • pH 7.36 • PaCO2 25 torr • HCO3- 17
STUDY QUESTIONS Interpret the following ABGs: pHPaCO2HCO3- 1 7.25 55 23 2 7.30 36 18 3 7.48 38 32 4 7.52 22 24
STUDY QUESTIONS Interpret the following ABGs: 7.37 57 32 7.36 31 17 7.44 23 15 7.43 49 32
STUDY QUESTIONS Interpret the following ABGs 7.32 32 16 7.50 23 18 7.33 62 32
Arterial • PaO2 • SaO2 • CaO2 • Hemoglobin level
Mixed Venous • PvO2 • SvO2 • CvO2 • Clinical significance
Hypoxemia • Evaluated by the PaO2 level • Dissolved oxygen in the plasma of the blood • 80 to 100 torr (Normal) • 60 to 79 torr (Mild hypoxemia) • 40 to 59 torr (Moderate hypoxemia) • Below 40 torr (Severe hypoxemia)
Total Oxygen Content dissolved O2 (PaO2) 3% O2 bonded to hemoglobin 97% (SaO2)
Total Oxygen Content • To evaluate the total amount of oxygen being delivered to the patient’s blood you must know: • PaO2 (oxygen dissolved in the plasma) • SaO2 (oxygen bonded with hemoglobin) • Hgb (the hemoglobin level in the blood)