7.1 Introduction to Spreadsheets
790 likes | 1.17k Vues
Learn about the history, functions, and basic operations of Microsoft Excel 2007. Understand data entry, formatting, and practical tips for creating effective spreadsheets.

7.1 Introduction to Spreadsheets
E N D
Presentation Transcript
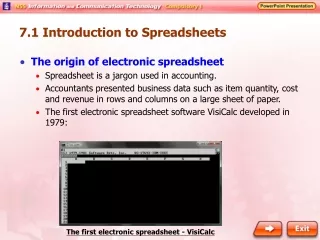
7.1 Introduction to Spreadsheets • The origin of electronic spreadsheet • Spreadsheet is a jargon used in accounting. • Accountants presented business data such as item quantity, cost and revenue in rows and columns on a large sheet of paper. • The first electronic spreadsheet software VisiCalc developed in 1979: The first electronic spreadsheet - VisiCalc
7.1 Introduction to Spreadsheets • The functions of an electronic spreadsheet • Spreadsheets allows users to input and organize data, create charts and perform data analysis. • Examples of spreadsheet software: Microsoft Excel, Corel Quattro Pro, OpenOffice.org Calc Microsoft Excel 2007 Corel Quattro Pro
7.1 Introduction to Spreadsheets • The functions of an electronic spreadsheet • Data in a spreadsheet is presented in rows and columns. • Users can carry out many mathematical operations and advanced data analysis using hundreds of predefined functions. • Usage: accounting reports, financial models, inventory reports, quotation and personal mail lists. A chart is created by using an electronic spreadsheet Chart
7.1 Introduction to Spreadsheets The functions of an electronic spreadsheet Data in a spreadsheet is presented in rows and columns Users can carry out many mathematical operations and advanced data analysis using hundreds of predefined functions. Usage: accounting reports, financial models, inventory reports, quotation and personal mail lists. A chart is created by using an electronic spreadsheet Chart
7.2 Basic Operations of Microsoft Excel 2007 • Working environment of Microsoft Excel 2007 • A spreadsheet file can contain many worksheets and the data on each of them can be interdependent. • Basic storage unit is called cell, which is arranged into rows and columns. • Each row is identified by a row number (from 1 to 1,048,576) while each column is identified by a letter (from A to XFD). • Each cell has a unique cell address formed by a column letter followed by a row number, e.g. A1 is the cell address of the top left corner of the spreadsheet
7.2 Basic Operations of Microsoft Excel 2007 • Working environment of Microsoft Excel 2007 Office button Display menu for file manipulations and setting options Column Ribbon Display tabs and their command buttons in groups Name box Show the cell address or defined name of the active cell Formula Bar Input or edit the content in the active cell Quick Access Toolbar Show frequently used command buttons Active cell The selected cell for editing Zoom Slider Zoom in or out of the active worksheet Active worksheet The worksheet that is currently in use Worksheet Row Working environment of Microsoft Excel 2007
7.2 Basic Operations of Microsoft Excel 2007 • Data entry and data format • To enter data or formula into a cell: • Select a cell. • Enter data into the cell. • Press ‘Enter’ to complete the input. • Three ways to modify the data in an active cell: • Press the function key ‘F2’ and then change the cell content in the cell. • Double-click the cell and then change the cell content in the cell. • Click the Formula Bar and then change the cell content in the Formula Bar.
7.2 Basic Operations of Microsoft Excel 2007 • Data entry and data format • Microsoft Excel formats the input data to one of the predefined cell formats such as number, text or percentage. • Users can change the cell format through the command buttons in the ‘Number’ group. Change cell formats in the ‘Format Cells’ dialogue box. Data presented in different formats
7.2 Basic Operations of Microsoft Excel 2007 • Data entry and data format • Microsoft Excel may not display the input data in the ways you expect. • Student ID ‘00812’ may be displayed as ‘812’. • Class name ‘4E2’ may be displayed as ‘4.00E+02’. • It is better to define the data format of the cells before the data is entered.
7.2 Basic Operations of Microsoft Excel 2007 • Data entry and data format 3. The data is displayed exactly as what a user has entered. 1. Select the cells to be formatted as text. 2. Select the option ‘Text’ from the ‘Number Format’ menu. Define the cell format before entering data.
7.2 Basic Operations of Microsoft Excel 2007 • Data entry and data format Merge and centre Merge or split selected cells Number format Contain predefined number format Bottom align Middle align Top align Font size Font Percentage style Bold Decrease decimal Italic Underline Increase decimal Align text to right Borders Centre text Comma style Background colour Align text to left Text colour Formatting commands on the ‘Home’ tab
7.2 Basic Operations of Microsoft Excel 2007 • AutoFill • Allow user to create a series of values based on the value of one or more selected cells adjacent to each other. • Fill up cells adjacent to the source in two different ways • Copy and paste • Extending the series
7.2 Basic Operations of Microsoft Excel 2007 • AutoFill • Copy and paste • Microsoft Excel tries to determine the pattern of data in the source. • If Microsoft Excel fails to identify the pattern, it simply fills up the adjacent cells repeatedly with the value in the source. • Examples: • the source which is a single cell • textual data without any number or not related to time and date
7.2 Basic Operations of Microsoft Excel 2007 • AutoFill • Extending the series • If Microsoft Excel successfully determines the pattern of data in the source, the adjacent cells are filled with values by extending the series. • AutoFill can be used to create number sequences, time lists, day lists, week lists, month lists and regular text patterns. Use AutoFill to fill a series of cell.
7.2 Basic Operations of Microsoft Excel 2007 AutoFill Extending the series If Microsoft Excel successfully determines the pattern of data in the source, the adjacent cells are filled with values by extending the series. AutoFill can be used to create number sequences, time lists, day lists, week lists, month lists and regular text patterns. Use AutoFill to fill a series of cell.
7.3 Formula and Cell Reference • Formula • An expression stored in a cell that performs calculations on the data in a worksheet • Begins with an equal sign (=) and is followed by a series of constants • References and formulae are connected by operators. Parentheses in a formula works in a similar way as those in arithmetic expressions.
7.3 Formula and Cell Reference • Elements of a formula Elements of a formula
7.3 Formula and Cell Reference • Elements of a formula Elements of a formula
7.3 Formula and Cell Reference • Elements of a formula Simple examples of formula
7.3 Formula and Cell Reference • Cell reference • A basic element in an Microsoft Excel formula. • It is used when we need to perform calculations involving the information of cells on a worksheet. • In a formula, cell references can be used in a combination of numbers, functions and cell references. • Types of cell references • Relative cell reference • Absolute cell reference • Mixed cell reference
7.3 Formula and Cell Reference • Cell reference Formula: = B2*(1-B4) Formula: = B5-B1 Formula: = B6/B1 The data in row 7 is defined in the ‘Percent’ style. The profit of selling an item under different discount percentages.
7.3 Formula and Cell Reference • Relative cell reference • It is formed by a column letter and a row number, e.g. A1 and B5. • When a cell containing a relative cell reference is copied and pasted into another cell, Microsoft Excel calculates the relative position of this cell and the location of the target cell. The cell reference in the target cell is changed accordingly.
7.3 Formula and Cell Reference • Relative cell reference Formula: = A1+A2 Formula: = A3+A4 Formula: = B3+B4 The cell references change accordingly when a cell containing relative reference is copied and pasted into other cells.
7.3 Formula and Cell Reference • Absolute cell reference • It identifies a specific cell by adding a symbol ‘$’ in front of the column letter and the row number, e.g. $A$3 and $F$10. • When a formula is copied or moved to other cells, the absolute cell reference in the formula remains unchanged.
7.3 Formula and Cell Reference • Absolute cell reference Formula: = $A$1+$A$2 Formula: = $A$1+$A$2 Formula: = $A$1+$A$2 The absolute cell references remain unchanged after the formula is copied to other cells.
7.3 Formula and Cell Reference • Mixed cell reference • It has a ‘$’ either before the column letter or the row number, e.g. $A5 and A$1. • When a formula is copied to other cells, the column letter or the row number with a ‘$’ remains unchanged, while the other part of the reference without the ‘$’ changes in the same way as a relative cell reference.
7.3 Formula and Cell Reference • Mixed cell reference Formula: = $A1+A$2 Formula: = $A3+A$2 Formula: = $A3+B$2 When a formula contains a mixed cell reference is copied to other cells, the part of the reference with a ‘$’ remains unchanged while the part without the ‘$’ changes.
7.3 Formula and Cell Reference Mixed cell reference Formula: = $A1+A$2 Formula: = $A3+A$2 Formula: = $A3+B$2 When a formula contains a mixed cell reference is copied to other cells, the part of the reference with a ‘$’ remains unchanged while the part without the ‘$’ changes.
7.4 Functions • Statistical function • Conduct data analysis on large volume of data. • Useful for finding out the tendency, distribution and characteristics of the data to make the analysis much easier Descriptions of commonly used statistical functions
7.4 Functions • Statistical function Descriptions of commonly used statistical functions
7.4 Functions • Statistical function Descriptions of commonly used statistical functions
7.4 Functions • Statistical function Example of applications of statistical functions
7.4 Functions • Mathematical functions • Tools for manipulating numbers in a spreadsheet • e.g. They can be used to sum up a series of numbers and round up numbers. Descriptions of commonly used mathematical functions
7.4 Functions • Mathematical functions Descriptions of commonly used mathematical functions
7.4 Functions • Mathematical functions Example of applications of mathematical functions
7.4 Functions • Logical functions • Used in building conditional formula. • Logical functions such as the ‘AND’, ‘OR’ and ‘NOT’ functions are often used together with the ‘IF’ function. Descriptions of commonly used logical functions
7.4 Functions • Logical functions Descriptions of commonly used logical functions
7.4 Functions • Logical functions Descriptions of commonly used logical functions
7.4 Functions • Text, date and time functions • Manage data other than numbers such as text, date and time. • Examples: • Convert one data type to another such as from number to text. • Extract information from the data. Descriptions of commonly used text functions
7.4 Functions • Text, date and time functions Descriptions of commonly used text functions
7.4 Functions • Text, date and time functions Descriptions of commonly used text functions
7.4 Functions • Text, date and time functions Descriptions of commonly used date and time functions
7.4 Functions • Text, date and time functions Descriptions of commonly used date and time functions
7.4 Functions • Text, date and time functions Descriptions of commonly used date and time functions
7.4 Functions • Text, date and time functions The ‘Date’ function is used in cell B1. The ‘Time’ function is used in cell E3 Example of applications of the data and time functions
7.4 Functions Text, date and time functions The ‘Date’ function is used in cell B1. The ‘Time’ function is used in cell E3 Example of applications of the data and time functions
7.5 Creating Charts • Chart • Use to visualize the relationship between data. • Important tool for data analysis and presentation. • Selection of chart type • Each type of chart has advantage over the other types to present certain kind of information. • Should choose the chart type carefully.
7.5 Creating Charts A pie chart A line chart A column chart Examples of different types of charts
7.5 Creating Charts • Selection of chart type Purposes of different types of charts
7.5 Creating Charts • Creating a simple chart • The first task to create a chart is to prepare the data series, known as the chart data. • The following shows the guidelines for preparing chart data: • Arrange each set of chart data either in rows or columns. • Mark each data series with a title whenever possible. • Do not include any blank cells between data. • After that, users can start to create a chart.