Download
1 / 18
240 likes | 803 Vues
7.1 Introduction to Hypothesis Testing. State a null and alternative hypotheses Type I and Type II Errors and interpretations of Level of Significance How to find P -value and when to use a one or two-tailed test Make and interpret a decision based on statistical testing

E N D
7.1 Introduction to Hypothesis Testing State a null and alternative hypotheses Type I and Type II Errors and interpretations of Level of Significance How to find P-value and when to use a one or two-tailed test Make and interpret a decision based on statistical testing Write a claim for a hypothesis test
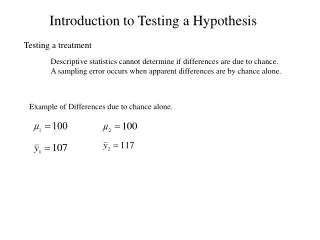
A hypothesis test is a process that uses sample statistics to test a claim about the value of a population parameter. Hypothesis test
A statement about a population parameter is called a statistical hypothesis. Statistical hypothesis
A null hypothesis is a statistical hypothesis that contains a statement of equality, such as ≤, =, or ≥. Null hypothesis
The alternative hypothesis is the complement of the null hypothesis. It is a statement that must be true if the null hypothesis is false and it contains a statement of strict inequality, such as >, ≠, or <. Alternative hypothesis
Write the claim as a mathematical sentence. State the null and alternative hypotheses, and identify which represents which claim. A consumer analyst reports that the mean life of a certain type of automobile battery is not 74 months. An electronics manufacturer publishes that the variance of the life of its home theater systems is less than or equal to 2.7. A realtor publicizes that the proportion of homeowners who feel their house is too small for their family is more than 24%. Null: μ = 74 Alternative: μ ≠ 74 (Claim) Null: σ²≤2.7 (Claim) Alternative: σ²> 2.7 Null: p ≤ 0.24 Alternative: p > 0.24 (Claim) Try it yourself 1 Stating the Null and Alternative Hypotheses
A type I error occurs if the null hypothesis is rejected when it is true. • A type II error occurs if the null hypothesis is not rejected when it is false. Types of Error
A company specializing in parachute assembly states that its main parachute failure rate is not more than 1%. You perform a hypothesis test to determine whether the company’s claim is false. When will a type I or type II error occur? Which is more serious? Null: p < 0.01 Alternative: p > 0.01 A type I error will occur if the actual proportion is less than or equal to 0.01, but you reject the null hypothesis. A type II error will occur if the actual proportion is greater than 0.01, but you fail to reject the null hypothesis. A type II error is more serious because you would be misleading the consumer, possibly causing serious injury or death. Try it yourself 2 Identifying Type I and Type II Errors
In a hypothesis test, the level of significanceis your maximum allowable probability of making a type I error. It is denoted by α, the lowercase Greek letter alpha. The probability of a type II error is denoted by β, the lowercase Greek letter beta. Level of significance
The statistic that is compared with the parameter in the null hypothesis is called the test statistic. Test statistic
If the null hypothesis is true, a P-value or (probability value) of a hypothesis test is the probability of obtaining a sample statistic with a value as extreme or more extreme than the one determined from the sample data. P-value (Probability value)
If the alternative hypothesis contains the less-than inequality symbol (<), the hypothesis test is a left-tailed test. Left-tailed test
If the alternative hypothesis contains the greater-than inequality symbol (>), the hypothesis test is a right-tailed test. Right-tailed test
If the alternative hypothesis contains the not-equal to symbol (≠), the hypothesis test is a two-tailed test. In a two-tailed test, each tail has an area of ½P. Two-tailed test
For each claim, state the null and alternative hypotheses in words and in symbols. Then determine whether the hypothesis test is a left-tailed, right-tailed, or two tailed test. Sketch a normal sampling distribution and shade the area for the P-value. A consumer analyst reports that the mean life of a certain type of automobile battery is not 74 months. An electronics manufacturer publishes that the variance of the life of its home theater systems is less than or equal to 2.7. A realtor publicizes that the proportion of homeowners who feel their house is too small for their family is more than 24%. Two-tailed test Right-tailed test Right-tailed test Try it yourself 3 Identifying the Nature of a Hypothesis Test
To use a P-value to make a conclusion in a hypothesis test, compare the P-value with α. • If P ≤ α, then reject the null hypothesis. • If P > α, then fail to reject the null hypothesis. Decision Rule based on P-value
You perform a hypothesis test for the following claim. How should you interpret your decision if you reject the null hypothesis? If you fail to reject the null hypothesis? Alternative hypothesis (claim): A realtor publicizes that the proportion of homeowners who feel their house is too small for their family is more than 24%. Reject the null hypothesis: There is enough evidence to support the realtor’s claim that the proportion of homeowners who feel their house is too small for their family is more than 24%. Fail to reject the null hypothesis: There is not enough evidence to support the realtor’s claim that the proportion of homeowners who feel their house is too small for their family is more than 24%. Try it yourself 4 Interpreting a Decision
You represent a chemical company that is being sued for paint damage to automobiles. You want to support the claim that the mean repair cost per automobile is less than $650. How would you write the null and alternative hypotheses? You are on a research team that is investigating the mean temperature of adult humans. The commonly accepted claim is that the mean temperature is about 98.6°F. You want to show that this claim is false. How would you write the null and alternative hypotheses? We want to support the claim. Null: μ> 650 Alternative: μ < 650 (Claim) We want to reject the claim. Null: μ = 650 (Claim) Alternative: μ ≠ 650 Try it yourself 5 Writing the Hypotheses