INTRODUCTION TO HYPOTHESIS TESTING
INTRODUCTION TO HYPOTHESIS TESTING. PURPOSE. A hypothesis test allows us to draw conclusions or make decisions regarding population data from sample data. The Logic of Hypothesis Tests. Assume a population distribution with a specified population mean.


INTRODUCTION TO HYPOTHESIS TESTING
E N D
Presentation Transcript
PURPOSE A hypothesis test allows us to draw conclusions or make decisions regarding population data from sample data.
The Logic of Hypothesis Tests • Assume a population distribution with a specified population mean. • State the hypothesized population mean (this statement is referred to as the null hypothesis). • Draw a random sample from the population and calculate the sample mean. • Determine the “relative position” on the calculated mean on the distribution of sample means. If the sample mean is “close” to the specified population mean, we do not have evidence to reject the hypothesized population mean. • If the calculated sample mean is “not close” to the specified population mean, we conclude that our sample could not have been drawn from the hypothesized distribution, and thus, we reject the null hypothesis.
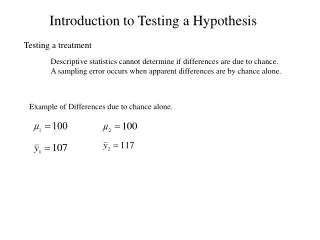
Example The president of City Real Estate claims that the mean selling time of a home is 40 days after it is listed. A sample of 50 recently sold homes shows a sample mean of 45 days with a standard deviation of 20 days. Is the president correct?
ONE SAMPLE HYPOTHESIS TESTS • Applied to determine if the population mean is consistent with a specified value or standard • Two tests • the z- test • the t-test
ONE SAMPLE HYPOTHESIS TEST Large Sample Sample size: n>25 Null and Alternative Hypothesis Ho: m = # Ha: m =/ # or m > # or m < #
ASSUMPTIONS: z-TEST • the underlying distribution is normal or the Central Limit Theorem can be assumed to hold • the sample has been randomly selected • the population standard deviation is known or the sample size is at least 25.
Example A manufacturer of electric ovens purchases components with a specified heat resistance of 8000. A sample of 36 components selected from a large shipment shows an average heat resistance of 7900 and a standard deviation of 200. Can the manufacturer conclude that the heat resistance of the glass components is less than 8000? clt
ONE SAMPLE HYPOTHESIS TESTSmall Samples Null and Alternative Hypothesis Ho: m = # Ha: m =/ # or m > # or m < #
ASSUMPTIONS: t-TEST • The underlying distribution is normal or the CLT can be assumed to hold • The samples have been randomly and independently selected from two populations • The variability of the measurements in the two populations is the same and can be measured by a common variance. (There is a t-test that does not make this assumption; it is available when using Minitab.)
EXAMPLE A manufacturer uses a bottling process and will lose money if the bottles do not contain the labeled amount. Suppose a cola company labels the bottles as 20 oz. A sample of 16 bottles results in 19.6 oz and a standard deviation of 0.3 oz. Does the process need an adjustment?
Paired Samples Test • Find the difference in the paired values • Treat the difference scores as one sample. • Apply a one sample test.
TWO-SAMPLES HYPOTHESIS TESTS Applied to compare the values of two population means.
The Distribution of the Difference Between Two Independent Samples clt
HYPOTHESIS TEST: TWO INDEPENDENT SAMPLESLarge Samples Sample Size: n < 25 Null and Alternative Hypothesis Ho: m1 = m2 Ha: m1=/ m2or m1> m2or m1< m2
HYPOTHESIS TEST:TWO INDEPENDENT SAMPLESSmall Samples Null and Alternative Hypothesis Ho: m1 = m2 Ha: m1 =/ m2or m1 > m2or m1< m2
Example Two machines are used in the manufacturer of steel rings. The quality control director wishes to know if she should conclude machine A is producing rings with a different inside diameter than those produced by machine B. clt
Example/Proportion Sports car owners complain that their cars are judged differently from sedans at the vehicle inspection station. Previous records indicate that 30% of all cars fail inspection on the first time. A random sample of 150 sports cars produced 60 that failed. Is there a different standard? clt
For large samples, point estimates and their margin of error as well as confidence intervals are based on the standard normal (z) distribution. Estimating the Difference in Population Means clt
Example/Proportions In producing a particular component, the Shelby Co. has a defective rate of 2%. In a sample of 500, a contractor found a rate of 1%. Has the quality improved? clt