Download

1 / 41
420 likes | 609 Vues
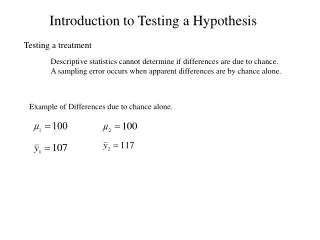
Introduction to Hypothesis Testing. What is a Hypothesis?. A hypothesis is a claim (assumption) about a population parameter: population mean population proportion. Example: The mean monthly cell phone bill of this city is = $42.

E N D
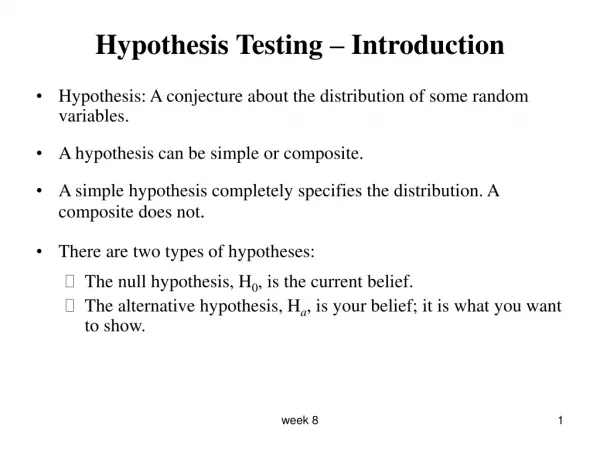
What is a Hypothesis? • A hypothesis is a claim (assumption) about a population parameter: • population mean • population proportion Example: The mean monthly cell phone bill of this city is = $42 Example: The proportion of adults in this city with cell phones is p = .68
Types of hypotheses Null Hypothesis, H0 • States the assumption (numerical) to be tested Example: The average number of TV sets in U.S. Homes is at least three ( ) • Is always about a population parameter, not about a sample statistic
Types of hypotheses Null Hypothesis, H0 (continued) • Begin with the assumption that the null hypothesis is true • Similar to the notion of innocent until proven guilty • May or may not be rejected
Types of hypotheses Alternative Hypothesis, HA • Is the opposite of the null hypothesis • e.g.: The average number of TV sets in U.S. homes is less than 3 ( HA: < 3 ) • May or may not be accepted • Is generally the hypothesis that is believed (or needs to be supported) by the researcher
Hypothesis Testing Process Claim:the population mean age is 50. (Null Hypothesis: Population H0: = 50 ) Now select a random sample x = likely if = 50? Is 20 Suppose the sample If not likely, REJECT mean age is 20: x = 20 Sample Null Hypothesis
Level of Significance, • Defines unlikely values of sample statistic if null hypothesis is true • Defines rejection region of the sampling distribution • Is designated by , (level of significance) • Typical values are .01, .05, or .10 • Is selected by the researcher at the beginning • Provides the critical value(s) of the test
Level of Significance and the Rejection Region a Level of significance = Represents critical value H0: μ≥ 3 HA: μ < 3 a Rejection region is shaded 0 Lower tail test H0: μ≤ 3 HA: μ > 3 a 0 Upper tail test H0: μ = 3 HA: μ≠ 3 a a /2 /2 Two tailed test 0
Types of test Lower Tail Tests H0: μ≥ 3 HA: μ < 3 • The cutoff value, , is called a critical value -zα a Do not reject H0 Reject H0 -zα 0 xα μ
Types of test Upper Tail Tests H0: μ≤ 3 HA: μ > 3 • The cutoff value, or , is called a critical value zα xα a Do not reject H0 Reject H0 zα 0 μ xα
Types of test Two Tailed Tests H0:μ = 3HA:μ¹ 3 • There are two cutoff values (critical values): or ± zα/2 /2 /2 xα/2 Lower Upper Reject H0 Do not reject H0 Reject H0 xα/2 -zα/2 zα/2 0 μ0 xα/2 xα/2 Lower Upper
Errors in Making Decisions • Type I Error • Reject a true null hypothesis • Considered a serious type of error The probability of Type I Error is • Called level of significance of the test • Set by researcher in advance
Errors in Making Decisions (continued) • Type II Error • Fail to reject a false null hypothesis The probability of Type II Error is β
Outcomes and Probabilities Possible Hypothesis Test Outcomes State of Nature Decision H0 True H0 False Do Not No error (1 - ) Type II Error ( β ) Reject Key: Outcome (Probability) a H 0 Reject Type I Error ( ) No Error ( 1 - β ) H a 0
Critical Value Approach to Testing • Convert sample statistic (e.g.: ) to test statistic ( Z or t statistic ) • Determine the critical value(s) for a specifiedlevel of significance from a table or computer • If the test statistic falls in the rejection region, reject H0 ; otherwise do not reject H0
Critical Value Approach to Testing x • Convert sample statistic ( ) to a test statistic ( Z or t statistic ) Hypothesis Tests for Known Unknown Large Samples Small Samples
Calculating the Test Statistic Hypothesis Tests for μ Known Unknown The test statistic is: Large Samples Small Samples
Calculating the Test Statistic (continued) Hypothesis Tests for Known Unknown The test statistic is: But is sometimes approximated using a z: Large Samples Small Samples
Calculating the Test Statistic (continued) Hypothesis Tests for Known Unknown The test statistic is: Large Samples Small Samples (The population must be approximately normal)
Steps in Hypothesis Testing • Specify the population value of interest • Formulate the appropriate null and alternative hypotheses • Specify the desired level of significance • Determine the rejection region • Obtain sample evidence and compute the test statistic • Reach a decision and interpret the result
Hypothesis Testing Example Test the claim that the true mean # of TV sets in US homes is at least 3. (Assume σ = 0.8) • H0: μ 3 HA: μ < 3 (This is a lower tail test) • Suppose that = .05 is chosen for this test
Hypothesis Testing Example Suppose a sample is taken with the following results: n = 100, x = 2.84 Then the test statistic is: But ztab = - 1.645 Since -2.0 < -1.645, we reject the null hypothesis that the mean number of TVs in US homes is at least 3
Upper Tail z Test for Mean ( Known) A phone industry manager thinks that customer monthly cell phone bill have increased, and now average over $52 per month. The company wishes to test this claim. (Assume = 10 is known) Form hypothesis test: H0: μ≤ 52 the average is not over $52 per month HA: μ > 52 the average is greater than $52 per month
Upper Tail z Test for Mean ( Known) (continued) Suppose a sample is taken with the following results: n = 64, x = 53.1 (=10 was assumed known) • Then the test statistic is: But ztab = 1.28 Do not reject H0 since 0.88 ≤ 1.28 i.e.: there is not sufficient evidence that the mean bill is over $52
The average cost of a hotel room in New York is said to be $168 per night. A random sample of 25 hotels resulted in x = $172.50 and s = $15.40. Test at the = 0.05 level. (Assume the population distribution is normal) Example: Two-Tail Test ( Unknown) H0:μ= 168HA:μ ¹168
a= 0.05 n= 25 is unknown, so use a t statistic Critical Value: t24 = ± 2.0639 Example Solution: Two-Tail Test H0:μ= 168HA:μ ¹168 a/2=.025 a/2=.025 Reject H0 Do not reject H0 Reject H0 tα/2 -tα/2 0 2.0639 -2.0639 1.46 Do not reject H0: not sufficient evidence that true mean cost is different than $168
Hypothesis Tests for Proportions • Involves categorical values • Two possible outcomes • “Success” (possesses a certain characteristic) • “Failure” (does not possesses that characteristic) • Fraction or proportion of population in the “success” category is denoted by p
Proportions (continued) • Sample proportion in the success category is denoted by p • When both np and n(1-p) are at least 5, pcan be approximated by a normal distribution with mean and standard deviation
Hypothesis Tests for Proportions • The sampling distribution of p is normal, so the test statistic is a z value: Hypothesis Tests for p np 5 and n(1-p) 5 np < 5 or n(1-p) < 5 Not discussed in this chapter
Example: z Test for Proportion A marketing company claims that it receives 8% responses from its mailing. To test this claim, a random sample of 500 were surveyed with 25 responses. Test at the = .05 significance level. Check: np = (500)(.08) = 40 n(1-p) = (500)(.92) = 460
a= .05 n = 500, p = .05 Z Test for Proportion: Solution Test Statistic: H0: p = .08HA: p¹.08 Decision: Critical Values: ± 1.96 Reject H0 at = .05 Reject Reject Conclusion: .025 .025 There is sufficient evidence to reject the company’s claim of 8% response rate. z -1.96 0 1.96 -2.47
p -Value Solution (continued) Calculate the p-value and compare to (For a two sided test the p-value is always two sided) Do not reject H0 Reject H0 Reject H0 p-value = .0136: /2= .025 /2= .025 .0068 .0068 0 -1.96 1.96 z = -2.47 z = 2.47 Reject H0 since p-value = .0136 < = .05
Type II Error • Type II error is theprobability of failing to reject a false H0 Suppose we fail to reject H0: μ 52 when in fact the true mean is μ = 50 50 52 Reject H0: μ 52 Do not reject H0 : μ 52
Type II Error (continued) • Suppose we do not reject H0: 52 when in fact the true mean is = 50 This is the range of x where H0 is not rejected This is the true distribution of x if = 50 50 52 Reject H0: 52 Do not reject H0 : 52
Type II Error (continued) • Suppose we do not reject H0: μ 52 when in fact the true mean is μ = 50 Here, β = P( x cutoff ) if μ = 50 β 50 52 Reject H0: μ 52 Do not reject H0 : μ 52
Calculating β • Suppose n = 64 , σ = 6 , and = .05 (for H0 : μ 52) So β = P( x 50.766 ) if μ = 50 50 50.766 52 Reject H0: μ 52 Do not reject H0 : μ 52
Calculating β (continued) • Suppose n = 64 , σ = 6 , and = .05 Probability of type II error: β = .1539 50 52 Reject H0: μ 52 Do not reject H0 : μ 52
Using PHStat Options
Sample PHStat Output Input Output
Chapter Summary • Addressed hypothesis testing methodology • Performed z Test for the mean (σ known) • Discussed p–value approach to hypothesis testing • Performed one-tail and two-tail tests . . .
Chapter Summary (continued) • Performed t test for the mean (σ unknown) • Performed z test for the proportion • Discussed type II error and computed its probability