Introduction to hypothesis testing
Introduction to hypothesis testing. Idea. Formulate research hypothesis H 1 New theory, effect of a treatment etc. Formulate an opposite hypothesis H 0 Theory is wrong, there is no effect, status quo This is often called “null hypothesis”

Introduction to hypothesis testing
E N D
Presentation Transcript
Idea • Formulate research hypothesis H1 • New theory, effect of a treatment etc. • Formulate an opposite hypothesis H0 • Theory is wrong, there is no effect, status quo • This is often called “null hypothesis” • The two hypotheses should be mutually exclusive: one or the other must be true • See if H0 could be rejected
Rules for rejecting • Assume that H0 is true • Use existing knowledge to construct a probability model for hypothetical data: what would be the relative frequency distribution of hypothetical data x after infinite repetition of sampling if the H0 was true • i.e. define p(x | H0) • Set up a decision rule: if the actual observed data x0 hits a “critical region” then reject H0 accept H1
Choosing the critical region • There is no theory for that • Common practice: P(x>k |H0)=0.05, k is called “critical value” • If x0>= k, then reject H0 • If x0<k, do not reject H0 • In other words: if P(x>x0| H0 )<0.05, then reject H0 • P(x>x0 |H0) : p-value
P-value in words • Frequency probability of hypothetical data being more “extreme” than the observed data we have, given that the null hypothesis is true. • Frequency probability statement about data that we do not have under the assumption that null hypothesis is true
What p-value is NOT • Probability of hypothesis being true given the observed data P(H0|x0) • Probability or probability density of observed data given that the hypothesis is true P(x0|H0) • Risk of being wrong if you claim that H0 is false
How to interpret in terms of H0 ? • There is no quantitative interpretation • Qualitatively, what can it mean: • If p-value <0.05 : • H0 is false, there is a true and practically meaningful effect • H0 is false, there is a true but practically meaningless effect, your sample size was large enough to pick that up • H0 is true, you were just “lucky” • If p-value >0.05 • H0 is false, there is a meaningful effect, but your sample size was too small to pick that up • H0 is false, there is a tiny effect, but your sample size was too small to pick that up • H0 is true, you were not lucky • Effect size, amount of data and plausibility of H0 all affect the qualitative conclusion
Statistical significance? • If the test statistics hits the critical region, the observed effect is often said to be statistically significant • However: there is no statistical theory which would define the concept directly • Meaning of statistical significance is defined by the person who designs the test: choice of critical region
Publication bias • H1: Rats who hear Rolling Stones live longer or shorter than those who hear Led Zeppelin • H0: No effect • 100 independent experiments by different research teams: • 8 studies with p-value < 0.05, • 92 studies with p-value > 0.05 • Because journals like p-value <0.05, those papers are much more likely to be published
Consequence? • When studied enough, p-value will eventually be less than 0.05 independent of the true state of H0 • Sensational findings pop-up easily • Publication policy exaggerates the phenomenon • Interpretation of p-value, once again? • small p-value: there is a potential mismatch between the observations and H0 • not-so-small p-value: H0 predicts the data reasonably well • Note, regardless of the p-value, the “mismatch” between H1 and data could be small or large
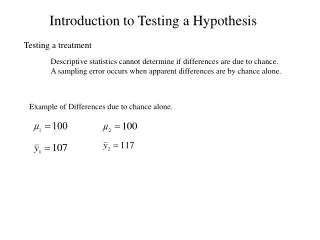
Example: effect of a treatment • H0: no effect: the means are equal • H1: some effect: the means differ • Assume equal and known variance in both groups • Assume normal distribution in both groups • Data: 10 measurements from both control and treatment • Summarize data with a statistic: m: group mean s: group standard deviation
Distribution of hypothetical data • Under H0, the t-statistic will follow a t-distribution with degrees of freedom equal to 18 (number of observations -2) when sampling is repeated infinitely • Critical region defined by the t-distribution after choosing 0.05 as significance level • P(| t |>k | H0)=0.05, k=2.1 • if |t| > 2.1, reject H0