Introduction to Hypothesis Testing
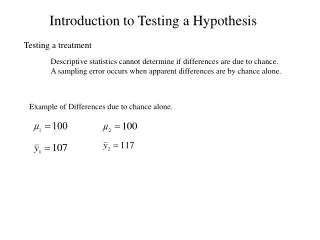
Introduction to Hypothesis Testing. Statistical Dilemma. AT&T believes the average telephone bill in Columbus, Georgia is $42.05 per month. They take a sample of 100 bills and find that the average value of the sample is $55.57. What does it mean?. Population. Now select a random sample.

Introduction to Hypothesis Testing
E N D
Presentation Transcript
Introduction to Hypothesis Testing AP Statistics
Statistical Dilemma AT&T believes the average telephone bill in Columbus, Georgia is $42.05 per month. They take a sample of 100 bills and find that the average value of the sample is $55.57. What does it mean? AP Statistics
Population Now select a random sample Conclusion: Mean age is lower than thought. How strong is the evidence? Sample Hypothesis Testing Compare the sample results to current accepted facts/thoughts. If currently accepted that mean age is 50 and sample mean is 20. AP Statistics
What is a Hypothesis? • A hypothesis is a theory proposed to explain a observation. • population mean • population proportion Example: The mean monthly cell phone bill of this city is = $42 Example: The proportion of adults in this city with cell phones is p = .68 AP Statistics
The Null Hypothesis, H0 • States the currently accepted fact Example: The average number of TV sets in U.S. Homes is at least three ( ) • Is always about a population parameter, not about a sample statistic AP Statistics
The Null Hypothesis, H0 • Assume that the null hypothesis is true until there is sufficient evidence to reject it. • Similar to the notion of innocent until proven guilty • Always contains “=” , “≤” or “” sign • May or may not be rejected • Never proven true or false AP Statistics
The Alternative Hypothesis, HA • Is generally the hypothesis that is believed by the researcher based on the sample. • Challenges the Ho • Is the opposite of the null hypothesis • e.g.: The average number of TV sets in U.S. homes is less than 3 ( HA: < 3 ) • Never contains the “=” , “≤” or “” sign • Stated as “≠”, “>” or “<“ AP Statistics
Reason for Rejecting H0 Sampling Distribution of the Statistic x 20 = 50 If H0 is true ... then we reject the null hypothesis that = 50. If it is unlikely that we would get a sample mean of this value ... ... if in fact this were the population mean… AP Statistics
Level of Significance, • Defines unlikely values of sample statistic if null hypothesis is true • Defines rejection region of the sampling distribution • Is designated by , (level of significance) • Typical values are .01, .05, or .10 • Is selected by the researcher at the beginning AP Statistics
H0: μ= 50 HA: μ > 50 a 0 Upper tail test H0: μ = 50 HA: μ≠50 a /2 Two tailed test Level of Significance and the Rejection Region Level of significance = a Rejection region is shaded H0: μ=50HA: μ < 50 a 0 Lower tail test a /2 0 AP Statistics
p-Value Approach to Testing • p-value: Probability of obtaining a test statistic more extreme ( ≤ or ) than the observed sample value given H0 is true • Also called observed level of significance AP Statistics
p-Value Approach to Testing • Obtain the p-value from a computer randomization model more extreme • Compare the p-value with • If p-value < , reject H0 • If p-value , do not reject H0 AP Statistics
Interpreting the p-value… Overwhelming Evidence (Highly Significant) Strong Evidence (Significant) Weak Evidence (Not Significant) No Evidence (Not Significant) 0 .01 .05 .10 AP Statistics
Dogs and Owners Pictures were taken of 25 owners and their purebred dogs, selected at random from dog parks. Study participants were shown a picture of an owner together with pictures of two dogs (the owner’s dog and another random dog from the study) and asked to choose which dog most resembled the owner. Of the 25 owners, 16 were paired with the correct dog. Is this convincing evidence that dogs tend to resemble their owners or just the results of random chance? How extreme is a phat of .64, if the results is random chance?
Distribution of sample proportions P-Value = .238 for two tail test
Attitude Toward Divorce Do men and women have different views on divorce? A May 2010 Gallup poll of U.S. citizens over the age of 18 asked participants if they view divorce as “morally acceptable”. Of the 1029 adults surveyed, 71% of men and 67% of women responded ‘yes’. What does the survey indicate? Men and women may differ in opinion. What is the no change hypothesis? Men and women do not differ in opinion.
Attitude Toward Divorce Is there sufficient evidence that men and women differ?
Caffeine and Finger Tapping Researchers trained a sample of male college students to tap their fingers at a rapid rate. The sample was then divided at random into two groups of ten students each. Each student drank the equivalent of about two cups of coffee, which included about 200 mg of caffeine for the students in one group but was decaffeinated coffee for the second group. After a two hour period, each student was tested to measure finger tapping rate (taps per minute). The goal of the experiment was to determine whether caffeine produces an increase in the average tap rate. What are the Null and Alternate Hypotheses
Hypotheses Or
Smiles and Punishment Researchers conducted a study examining the effect of a smile on the leniency of disciplinary action. For each suspect, along with a description of the offense, a picture was provided with either a smile or neutral facial expression. A leniency score was calculated based on the disciplinary. The experimenters are testing to see if the average lenience score is higher for smiling students than it is for students with a neutral facial . What are the null and alternate hypotheses?
Smiles and Punishment If α = .05, is the results statistically significant?
NFL Uniforms vs Penalties In a study of relationships between the type of uniforms worn by professional sports teams and the aggressiveness of the team, they consider teams from the National Football League (NFL). Participants with no knowledge of the teams rated the jerseys on characteristics such as timid/aggressive, nice/mean and good/bad. The averages of these responses produced a “malevolence” index with higher scores signifying impressions of more malevolent uniforms. To measure aggressiveness, the authors used the amount of converted to z-scores and averaged for each team over the seasons from 1970-1986. r = 0.43 Is there a correlation between uniforms and penalties in the NFL? What are Ho and Ha?
Lithium vs Placebo An experiment to investigate the effectiveness of the two drugs desipramine and lithium in the treatment of cocaine addiction was conducted. Subjects (cocaine addicts seeking treatment) were randomly assigned to take one of the treatment drugs or a placebo so that there were 24 patients in each group. The results of the study are summarized in the table below. The question of interest is whether lithium is more effective at preventing relapse than taking an inert pill. State the null and alternative hypotheses. How would you test these hypotheses?
Type I and Type II Errors Possible Hypothesis Test Outcomes State of Nature Decision H0 True H0 False Do Not No Error Type II Error Reject No Error Type I Error Reject
Practical vs Statistical Significance Local college offers an SAT preparation course and provides a statistical analysis on its website showing that 95% of students improve their SAT score after taking their $1000 course. How much would it have to improve your score to make the cost of the course worthwhile? 50 points? 100 points? 300 points? Statistically significant results does not imply the size of the difference.