Introduction to Hypothesis Testing
Hypothesis testing is a fundamental aspect of inferential statistics, focusing on making inferences about population parameters through claims or statements. The null hypothesis (H0) serves as the baseline assertion, while the alternative hypothesis (H1) represents the claim being tested. This text explains the significance levels, critical regions, and the probabilities of Type I and Type II errors (α and β). It emphasizes the importance of formulating correct hypotheses, outlines testing procedures, and discusses the implications of sample size on error rates.


Introduction to Hypothesis Testing
E N D
Presentation Transcript
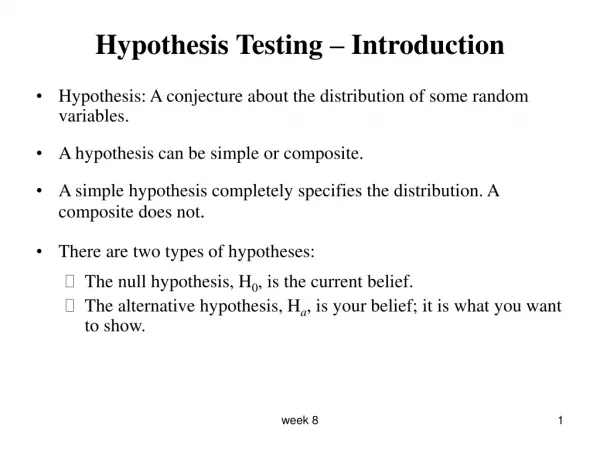
Definition Hypothesis in statistics, is a claim or statement about a property of a population
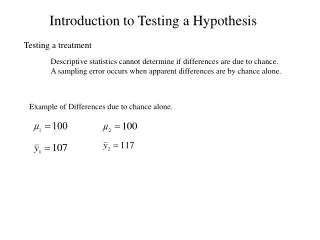
If under a given assumption, the probability of an observed event is exceptionally small, we conclude that the given assumption is probably not correct. Rare Event Rule for Inferential Statistics
Statement about value of population parameter • Must contain condition of equality • =, , or • Test the Null Hypothesis directly • Reject H0 or fail to reject H0 Null Hypothesis: H0
Must be true if H0 is false • One of three forms: , <, > Alternative Hypothesis: H1
If you are conducting a study and want to use a hypothesis test to support your claim, the claim must be worded so that it becomes the alternative hypothesis. Note about Forming Your Own Claims (Hypotheses)
For large samples, testing claims about population means the test statistics is: x - µx z= n Test Statistica value computed from the sample data that is used in making the decision about the rejection of the null hypothesis
Critical Region (or Rejection Region) Set of all values of the test statistic that would cause a rejection of the null hypothesis Critical Region Critical Region
Critical Region (or Rejection Region) Set of all values of the test statistic that would cause a rejection of the null hypothesis Critical Region Critical Region
Set of all values of the test statistic that would cause a rejection of the null hypothesis Critical Regions Critical Region
denoted by • the probability that the test statistic will fall in the critical region when the null hypothesis is actually true • The probability of rejecting the null hypothesis • common choices are 0.05, 0.01, and 0.10 Significance Level of the Hypothesis Test
Always test the null hypothesis 1. Reject the H0 2. Fail to reject the H0 need to formulate correct wording of finalconclusion Conclusions in Hypothesis Testing
The mistake of rejecting the null hypothesis when it is true. • (alpha) is used to represent the probability of a type I error Type I Error
the mistake of failing to reject the null hypothesis when it is false. • ß (beta) is used to represent the probability of a type II error Type II Error
What’s true in Reality The null hypothesis is true The null hypothesis is false Type I error (rejecting a true null hypothesis) Reject the null hypothesis Correct decision Decision based on Hypothesis Test Type II error (rejecting a false null hypothesis) Fail to reject the null hypothesis Correct decision Type I and Type II Errors
For any fixed , an increase in the sample size nwill cause a decrease in • For any fixed sample size n, a decrease in will cause an increase in . Conversely, an increase in will cause a decrease in . • To decrease both and , increase the sample size. Controlling Type I and Type II Errors