Download
1 / 19
200 likes | 312 Vues
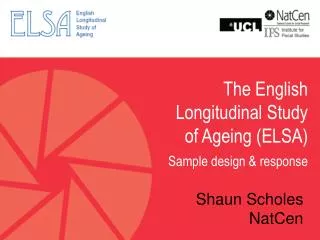
The English Longitudinal Study of Ageing (ELSA) Sample design & response. Shaun Scholes NatCen. Content. Presentations on weighting are incredibly dull (!) so: A focus on sample design: Who’s included? Who’s excluded and why?

E N D
The English Longitudinal Study of Ageing (ELSA) Sample design & response Shaun Scholes NatCen
Content Presentations on weighting are incredibly dull (!) so: A focus on sample design: Who’s included? Who’s excluded and why? A brief analysis of response by Wave 3 (for those who took part at Wave 1): Who remains? Who drops-out?
Include if belong to ELSA’s target population: Persons aged 50+ (age-eligibility) Living in private households in England (wave 1) and Great Britain (subsequent waves) Institutional interviews Partners interviewed but not of interest in themselves: ‘End-of-life’ interview Understand circumstances of couple Understand circumstances after ‘split’ Sample design (1) – Eligibility (core members)
Sample design (2) – issued for fieldwork • Being eligible (i.e. in target population) does not guarantee being issued for fieldwork • Respondents at HSE/each ELSA wave could have refused permission to be re-contacted: • BUT we use a household rather than individual definition • Individual ‘refusers’ still have an opportunity to take part if another eligible person in the household did not refuse re-contact
Origin of the ELSA sample • ELSA is a follow-up of Health Survey for England responding households: • Benefits of follow-up: • Nationally representative of private households • Identify eligible individuals at reasonable cost • Wide range of information already collected • Respondents took part in survey already so more likely to take part in new survey • Disadvantages of follow-up: • Initial non-response • Refusals to be re-contacted for further study • Drop-out between initial and follow-up survey
Composition of ELSA sample • Determined by: • Being in a responding HSE HH • Eligibility: • Age (Cohort 1 core members born before 1 March 1952) • Living in private household in England at time of wave 1 • Being a partner of sample member • Whether issued for fieldwork: • Age-eligible person in HH agreeing to further contact post HSE • Propensity to respond conditional on being issued: • Household level non-response • Individual level non-response within responding households • Item/module non-response • Self-completion questionnaire (all waves) • Income information (all waves) • Nurse visit and blood sample (waves 2 & 4)
Stage 1 HSE sample 31,051 households Stage 2 Households responding to HSE 23,132 households Households non-responding to HSE 7,919 households Stage 3 Households containing 1+ age-eligible individual 13,203 households containing 21,193 SM/YP Households without age-eligible individuals 9,929 households Stage 4 Households dropped 401 households Households containing 1+ living age-eligible individuals 12,802 HHs - 20,764 SM/YP Stage 5 Households dropped 1,224 households containing 1,951 individuals (including 43 dead) Households permitting re-interview 11,578 households containing 18,813 SM/YP ELSAsampledefinition SM - Age-eligible sample member YP - Young partner
Stage 6 Stage 7 Stage 8 Stage 9 HH issued 11,577 HHs, containing 18,824 individuals New HH 91 HHs, containing 96 individuals All ELSA HH containing 1+ age-eligible individual 11,373 HHs - containing 18,563 individuals ELSA HH dropped (ineligible) 296 households containing 357 individuals Responding HH (at least 1 CM/YP/NP responding) 7,935 households containing 12,942 individuals Non-responding HH 3,438 households containing 5,621 individuals Responding individuals 12,099 CM = 11,391 YP = 636 NP = 72 Non-responding individuals 502 Individuals dropped (ineligible) 340 Responseat W1 CM – core member YP – young partner NP – new partner
Stage 1 All HH containing at least 1 CM, YP or NP responding in wave 1 7,934 households Stage 2 HH not issued 343 households HH issued 7,591 households New HH formed 34 households Stage 3 Ineligible HH 175 households Responding HH 6,277 households Non-responding HH 1,173 households Stage 4 Responding individuals 9,433 CM = 8,781 CP = 57 YP = 501 NP = 94 Non-responding individuals 420 CM = 120 CP = 215 YP = 44 NP = 41 Ineligible individuals 227 CM (deaths) = 181 CM (institutional moves) = 14 CP = 7 YP = 25 Response tree from wave 1 to wave 2 CM Core member CP Core partner YP Young partner NP New partner (entering study at waves 1 and/or 2)
Response over three waves • Focus here on Cohort 1 core members (took part at wave 1) • The next slide shows, at each wave, the number of: • R ~ Respondents • NR ~ Non-respondents • refusals • Non-contacts • Unable to trace • ‘Other’ (e.g. ill/away during fieldwork) • I ~ Ineligible cases (known ineligibility)
R I W1 NR W2 W3
Non-response • Non-response causes two problems for longitudinal surveys (Uhrig, 2008): • Lower sample size results in lower precision • Non random non-response means sample becomes unrepresentative as the longitudinal sample ages. Bias exists when the R and NR vary with respect to outcomes • Advantage of panel surveys (compared to cross-sectional ones) is that we have survey data collected at the first wave (Lynn, 2008) to compare R and NR - and use for weighting.
Predictors of non-response • Four groups of eligible cases are compared across selected W1 variables: • XXX (took part in all 3 waves) • XXO (dropped out after W2) • XOX (returned at W3 after missing W2) • XOO (dropped out after W1) • All wave 1 respondents used as the benchmark. If NR = random all distributions would equal the W1 distribution (Lynn et al., 1994) • Hypothesis: • XXX = most educated/affluent, younger, healthier • XOO = least educated/affluent, older, poorer health • XOX/XXO = somewhere in between
Conclusions • Many steps to go through to have been selected for the ELSA sample and to have taken part in all three waves. • Be aware of the existence of different cohorts as time progresses. • Be critical/cautious about the types of respondents who remain - a random subset of the target population? Probably not.
References • Lynn P (2008) ‘Non-response’ in E.De. Leeuw, J.J. Hox and D.A. Dillman International Handbook of Survey Methodology (New York: Lawrence Erlbaum Associates). • Lynn, P., Purdon, S., Hedges, B. and McAleese, I. (1994), The Youth Cohort Study: An Assessment of Alternative Weighting Strategies and their Effects, Employment Department Research Series YCS. Report no.30. • Uhrig, S.C. Noah (2008) ‘The nature and causes of attrition in the British Household Panel Survey’, Working Papers of the Institute for Social and Economic Research, paper 2008-05. Colchester: University of Essex.
Further questions • s.scholes@natcen.ac.uk