Remote Sensing Derived Land Use/Cover Data for Urban Modeling in MM5 and WRF
Remote Sensing Derived Land Use/Cover Data for Urban Modeling in MM5 and WRF . Susanne Grossman-Clarke 1 Joseph A. Zehnder 1 William Stefanov 2 Matthias Moeller 1 1 International Institute for Sustainability, Arizona State University

Remote Sensing Derived Land Use/Cover Data for Urban Modeling in MM5 and WRF
E N D
Presentation Transcript
Remote Sensing Derived Land Use/Cover Data for Urban Modeling in MM5 and WRF Susanne Grossman-Clarke1 Joseph A. Zehnder1 William Stefanov2 Matthias Moeller1 1International Institute for Sustainability, Arizona State University 2Image Science and Analysis Laboratory, NASA Johnson Space Center Funded by National Science Foundation, NASA, Salt River Project
Representation of urban areas in mesoscale meteorological models • Land use/cover classes and physical characteristics. • Physical description of momentum, energy and matter exchange between the urban surface and the atmosphere.
Land use data in MM5 & WRF • Global 24-category USGS Land Use/Cover. • Vegetation cover from 1-km Advanced Very High Resolution Radiometer data (1992/1993). • Urban areas from Digital Chart of the World (Defense Mapping Agency 1992; photogrammetric analyses imagery acquired in the 1960s).
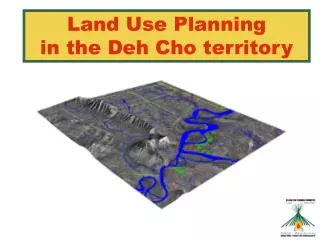
The Phoenix Metropolitan area Brazel et al. 2000: The tale of two climates—Baltimore and Phoenix urban LTER sites. Clim Res., Vol. 15: 123–135.
Remote sensing derived land use/cover data for Phoenix, AZ • Based on Landsat Thematic Mapper satellite images. • Postclassification in expert system using additional data sets. • Land cover data 30 meter resolution. Stefanov et al. 2001, Remote Sens. Environ., 77, 173-185.
Convert data for use in MM5 • Re-projecting data to the geographic projection parameters of 30-second USGS data set. • Mapping categories to 24 USGS categories. • Land cover class with highest fraction of cover assigned to 30 s grid cell. • Additional urban land use/cover classes: • urban built-up (no vegetation) • mesic residential (well-watered) • xeric residential (drought-adapted vegetation)
MM5 TERRAIN 2 km land use/cover standard improved
Refinements to model physics • Sky view factor. • Anthropogenic heating from cars and air conditioners (Sailor and Lu 2004). • Volumetric heat capacity and thermal conductivity of man-made materials.
Sky view factor road Sky view factor for roads sky Sky view factor h Building height w Road width Rlong Long-wave radiation balance L Incoming long-wave radiation Tg Ground temperature eg Emissivity of the ground
Anthropogenic heat Qa,vQa,eAnthropogenic heat from traffic and electricity consumption rpop Avg. population density for urban LU classes h Hour of day Ft Fe Hourly fractional traffic profiles and electricity consumption DVDc Avg. daily vehicle distance traveled per person in Phoenix EV Energy release per vehicle per meter of travel Ec Daily per capita electricity consumption
Diurnal variation of anthropogenic heat for Phoenix (-x -) urban built-up; (--) mesic residential; (--) xeric residential
Design of numerical simulations • 1700 LST June 07 – 1700 LST June 10, 1998. • Nested 54, 18, 6, 2 km. • 51 vertical layers. • NCEP Eta Analysis 40 km. • 30 sec terrain & land use data. • MRF boundary layer scheme (Liu et al. 2004). • 5 layer soil model.
Simulations of the surface temperature Heat storage, anthropogenic heat, sky view factor improves nighttime temperatures. Correcting landcover improves daytime temperatures. Model performance validated with observations from the National Weather Service, Salt River Project (PRISMS) and U of Arizona Agricultural Extension (AZMET) through a variety of landcover categories
Regional surface temperature prediction (8 June 1998) 5 pm 5 am Relatively little temperature difference between urban and desert areas during the day Urban heat island at night Temperatures 8-10 oF in city compared to outlying areas
Simulated surface energy fluxes for 7-10 June 1998 at Sky Harbor Airport (—) net radiation; (---) sensible heat flux; (---) latent heat flux;(—) heat storage flux for original and ‘urbanized’ values of cg and T.
Simulated surface energy fluxes for 7-10 June 1998 at Pringl (change from ‘shrubland’ to ‘xeric residential’) (—) net radiation; (---) sensible heat flux; (---) latent heat flux;(—) heat storage flux for the 1998 26-category and USGS 24-category LULC.
Simulated surface energy fluxes for 7-10 June 1998 at Sheely (change from ‘irrig. ag.’ to ‘xeric residential’) (—) net radiation; (---) sensible heat flux; (---) latent heat flux;(—) heat storage flux for the 1998 26-category and USGS 24-category LULC.
Simulated surface energy fluxes for 7-10 June 1998 at Pera (change from ‘urban’ to ‘xeric residential’) (—) net radiation; (---) sensible heat flux; (---) latent heat flux;(—) heat storage flux for the 1998 26-category and USGS 24-category LULC.
Land use/cover characteristics in WRF/Noah/UCM • Fraction cover of vegetation and man-made surfaces. • Four urban LULC classes (high, medium, low density and commercial industrial). • Building height, coverage area, roof and wall area ratio. • Roughness length and zero plane displacement height. • Albedo and emissivity. • Thermal conductivity and volumetric heat capacity of roof, wall and road.
Challenge • Derive WRF/Noah/UCM input parameters in an efficient and easy to update way for US cities and cities around the globe. • Use of remote sensing derived data from Satellite or Lidar.
ASTER derived land use cover for use in WRF/Noah/UCM • Advanced Spaceborne Thermal Emission and Reflection Radiometer (ASTER). • 3 bands visible to near-infrared 15m/pixel; 6 bands shortwave infrared 30m/pixel; 5 bands thermal infrared 90m/pixel. • In comparison to Landsat: • Expanded wavelength range • Improved spectral resolution • Higher Spatial resolution
Two step image post-processing using an object-oriented classification approach • Derive urban land use/cover classes from fractions of non-vegetation cover. • Derive input parameters. • Roof cover from vnir and shape detection. • Vegetation cover from vegetation index. • Roads, gravel etc. from swir. • Albedo from bidirectional reflectance.
Conclusions • Urban land use/cover classification and associated physical parameters important for mesoscale meteorological modeling. • LULC and some of the physical paramters can be efficiently derived from satellite imagery. • Support from funding agencies necessary.