Download
1 / 29
290 likes | 502 Vues
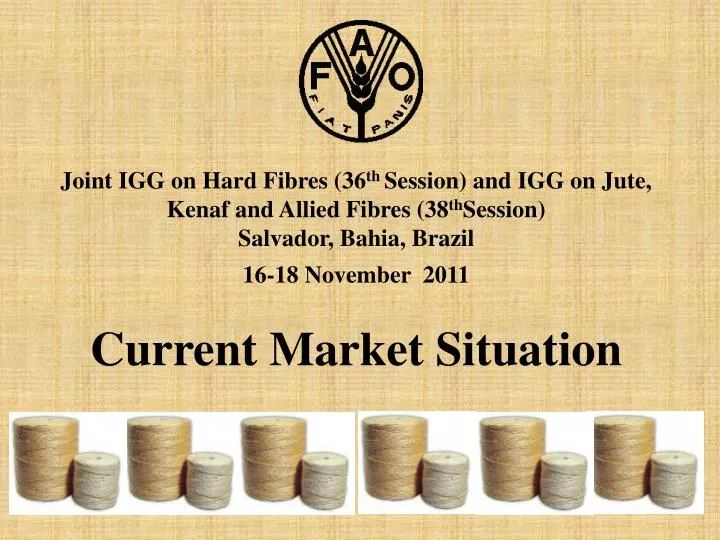
Joint IGG on Hard Fibres ( 36 th Session) and IGG on Jute, Kenaf and Allied Fibres ( 38 th Session) Salvador, Bahia, Brazil 16-18 November 2011 Current Market Situation. Introduction. Analysis of recent market developments and short term prospects

E N D
Joint IGG on Hard Fibres (36th Session) and IGG on Jute, Kenaf and Allied Fibres (38thSession) Salvador, Bahia, Brazil 16-18 November 2011 Current Market Situation
Introduction • Analysis of recent market developments and short term prospects • Statistical Bulletin CCP: JU/HF/ST/2011/1 • Delegates requested to update information and suggest improvements • Since mid-2000s growing innovative industrial uses due to rising prices of synthetic substitutes and environmental friendly properties of natural fibres • While production and trade declined in 2008 and 2009, markets began to recover in 2010 and may be poised for stronger growth in 2011 and 2012.
World Fibre production Global production of hard fibres, and jute in 2010 reached 4.18 million tonnes, an increase of 12.8 % Jute accounted for the largest volume, followed by coir, sisal and other fibres such as henequen, fique and abaca
Prod. - Jute, Kenaf, and Allied Fibres World :increased by 17 % in 2010/11 to 3.1 million tonnes India : 1.9 million tonnes Bangladesh : 990 000 tonnes China : 75 000 tonnes Nepal : 17 000 tonnes Myanmar : 8 000 tonnes Thailand : 1 800 tonnes.
Jute Prices Although prices fell sharply at the beginning of 2010/11 in comparison to the record levels attained in 2009/10, prices remained higher than at any other time during the past decade
Price of competing synthetics • The main synthetic petroleum based fibre is polypropylene. • Propylene is the base chemical and its prices move with oil prices Quotations in early 2011 averaged USD1500/t cf. USD 1440 in 2008, USD 900 in 2005 and USD 515 in 2000 • Price increases transmitted along the synthetic value chain, esp. from propylene to polypropylene fibre and products depend on the price of competing jute and jute products • Price increases are not totally transmitted to polypropylene if the increase in price compromised competitiveness of synthetics • However, with the sustained high crude oil price, it has become increasingly difficult to absorb the increases along the synthetic value chain, resulting in reduced competitiveness viz. natural fibres.
Exports of Jute, Kenaf and Allied Fibres : 2010/11 World exports increased: Fibres : 378 200 tonnes; products :738 200 tonnes . Bangladesh largest exporter of raw jute accounting for 97% of the world total and 60% of products India, the next largest exporter accounted for about 25 percent Smaller volumes exported from countries in the Far East, the Near East and Latin America, while Europe re-exports 20 000 tonnes of jute products
World Jute Imports - 2010 Raw jute: 410 200 tonnes Far East: 358 200 tonnes (87% of World) China: 104 000 tonnes Pakistan : 100 000 tonnes India: 90 000 tonnes Jute products : 600 900 tonnes, an annual increase of 13 percent Near East remained the largest (Turkey) Followed by Europe, Africa, the Far East and North America.
Jute Outlook – 2011/12(Preliminary Estimates) • World prod. expected to remain at a similar level to 2010/11 • Bangladesh :estimates are lower despite extended planting due to crop damage with excessive rain; and premature harvesting resulting shorter fibres • Insect damage also resulted in lower fibre yields • Production in India did not expand due to high stock levels held by traders. Consequently Government to subsidize (Rs. 100 per quintal) jute purchases by Jute Corporation of India.
2010 Sisal and Henequen - Prod World sisal output increased to 218th tonnes. Brazil accounted for 50%; followed by China 14 %; Tan 11%; Ken 10% and Mad 4%; Prod in Tanzania and Madagascar recovered from drought induced declines. Production of henequen continued to be dominated by Mexico but output in 2010 was well below the last 19 yrs average. While Colombia accounted for the bulk of fique production
Sisal Prices • Strengthening demand for sisal underpinned an upward trend in prices in East Africa and Brazil • East African prices in 2011 rose to a record high of USD1750 per tonne for 3L and USD1650 per tonne for UG in September 2011 • From USD1170 per tonne for 3L and USD1070 per tonne for UG in September 2010 • Brazilian sisal prices have also increased from an average of USD 689 per tonne in 2010 to an average of about USD730 per tonne during the first half of 2011
Sisal Exports • World exports of sisal fibre : 70 000 tonnes in 2010 • Shipments were higher from all major producing countries: • Brazil: 30 000 tonnes • Kenya : 20 000tonnes • Tanzania : 11 000 tonnes • Madagascar : 7 800 • Exports of sisal products was 80 000 tonnes in 2010, a reduction from 98 500 tonnes averaged over the last decade. • Brazil was the leading exporter with shipments of sisal and sisal products increasing 11 % to 66 300 tonnes while • Exports of cordage from Tanzania reached the highest volume attained in five years, at 6 200 tonnes – a 17 % increase
Sisal Trade • Exports of fibre also increased, from 8 200 tonnes in 2009 to 11 600 tonnes in 2010 • On the import side, imports of sisal products or manufactures declined to 64 500 tonnes in 2010, the lowest level reached in the past ten years. Imports by North America declined by 10 000 tonnes , but remained the largest importer, accounting for 55 percent of the world total, followed by Europe at 25 percent.
Outlook for Sisal • Firm prices over the past 18 months in East Africa reflected tight supplies, reportedly as a result of adverse weather conditions, coupled with the continued high oil prices which have increased cost of production and eroded producer margins • On the contrary, in Brazil favourable weather was conducive for production with higher yields offsetting the increased cost of production attributed to higher oil prices • Import demand for sisal fibre in 2011 is expected to remain at average levels, considering the rising price levels experienced for East African supplies. On the contrary, some recovery may occur in imports of sisal products from the particularly low 2010 level, but lagging economic growth in some of the major markets may continue to have a dampening effect, particularly in North America.
Abaca Production • Production of abaca fibre increased by 2 400 tonnes in 2010 to reach 70 000 tonnes • Estimates for 2011 indicate a 15 percent increase in output. • Production of manufactured abaca products also increased in 2010, recovering from a dip in 2009 when global economic conditions weakened the market for most manufactured fibre products.
Prices of abaca remained stable over 2010 with a slight increase towards the second part of the year continuing into 2011.
Abaca Trade • Demand for abaca fibre is almost exclusively for domestic consumption. Philippines exported 20 % of its fibre output in 2010, and a similar shipment expected for 2011 • Manufactured products: 76 % twine, cordage, ropes and 60 % pulp is exported. • Export volumes of abaca fibre and products recovered in 2010 from the sharp decline recorded in 2009. It has been reported widely that the decline was due to the contraction in demand, possibly due to the impact of the global economic recession. However, relatively firm prices do not fully support this reported claim. Rather a tightening in supply could be the main reason for the decline in shipment volumes. • Destinations of exports vary by product. The EU, Japan and China continue to be the largest importers of abaca fibre, accounting for 94 percent of the total in 2010, whereas the United Kingdom and Germany were the main destinations for pulp. For cordage, the United States accounted for more than 40 percent of the market.
Abaca Outlook • Outlook for 2011 suggests output and trade volumes would continue to increase reflecting the production recovery in the Philippines from the shortfall of 2009, and the increasing trend is expected to continue in 2012.
Coir Production • Production of brown coir was estimated to marginally increase to 653 300 tonnes in 2010, as prices remained firm • Production of brown coir in India has steadily increased in recent years to reach 415 500 tonnes in 2010, nearly 65 percent of the world total • India also produced 100 000 tonnes of white coir in 2010, a volume which has remained stable over the past few years, and 296 500 tonnes of coir yarn, which was about 97 percent of the world total. .
The average price of coir fibre and products was USD 526 per tonne in 2010 increasing to USD 548 per tonne in the first quarter of 2011 underpinned by continued strong demand in the market.
Coir Trade • Exports of coir fibre showed a pronounced upward trend in recent years reaching 529 330 tonnes in 2010 an annual increase of almost 20 percent and double the volume shipped in 2005 • In addition, 65 000 tonnes of coir products were exported • While substantial import growth has taken place into developed countries, a sharp growth in developing countries may be underestimated, particularly in recent years when the gap between reported exports and imports has widened considerably
Concluding Remarks • The regular assessment of the current market situation and medium-term projections are necessary for: • identifying potential growth markets and focus efforts at expanding demand of these fibres which has been stagnant for the last few decades; • The supply and demand analyses are also necessary for strategic planning and formulation of enabling policies required for the development of the sub-sectors; • However, in order to carry out this assessment, stakeholders should be forthcoming with the information. • In particular, delegates are requested to address the following specific issues:
Concluding Remarks - Cont • 1. Questionnaires : should be filled out accurately, and returned to the Secretariat on time. The response rate to these questionnaires has been low. • 2. Jute Indicative Price : Since 2006 the Secretariat has been receiving quotations for BTD and BTC prices instead of BWD and BWC due to scarcity of these grades. Perhaps the indicative price should be BTD instead of BWD – or is there any chance of getting monthly BWD prices?
Concluding Remarks - Cont • 3. Issues concerning jute data: • Questionnaires must be sent back to FAO on time; • Monthly data from the major producing countries twice a year; • Bangladesh: No response to questionnaire or monthly info in two years; • India: Always replies, but Need additional info to fulfil gaps • c) Myanmar: need response to questionnaire • d) Thailand: we need monthly data (see attachment) • e) Nepal: we need a reply to our questionnaire as well as monthly data if possible • f) China: we need a reply to our questionnaire (we need data from 2007)
Concluding Remarks - Cont 4. Abaca and Coir Issues • As the Harmonized System’s classification was revised effective January 1, 2007, the HS code 5305.11 and 5305.19 (for raw coir) and 5305.21 and 5305.29 (for raw abaca) were merged together under the code 530500; • Therefore, information on trade for these items are estimated based on the information we have for previous years. If the major producing countries could provide us with exports by destination, this would allow us to better compile information on trade.
Concluding Remarks - Cont • POLYPROPYLENE PRICES • It is increasingly difficult to obtain information on polypropylene prices • The information on PP Raffia grade ends in 2007, and the information on PP products, that is used for our analysis on the comparative price position of jute products vs. PP products ends in 2009 • Could anyone provide this information or suggest anyone to contact?