Efficient ENFA Analysis for Habitat Selection Study
Obtain raster maps of study area and target species location, analyze using ENFA in R with Adehabitat and Ade4 packages for habitat preference and niche breadth.

Efficient ENFA Analysis for Habitat Selection Study
E N D
Presentation Transcript
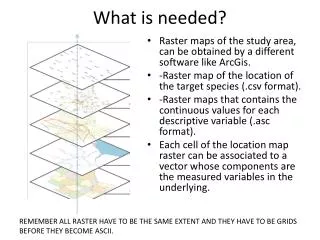
What is needed? • Raster maps of the study area, can be obtained by a different software like ArcGis. • -Raster map of the location of the target species (.csv format). • -Raster maps that contains the continuous values for each descriptive variable (.asc format). • Each cell of the location map raster can be associated to a vector whose components are the measured variables in the underlying. REMEMBER ALL RASTER HAVE TO BE THE SAME EXTENT AND THEY HAVE TO BE GRIDS BEFORE THEY BECOME ASCII.
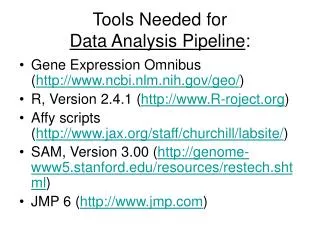
To run ENFA • In R, we need to load the adehabitat and ade4 packages. Developed by Clement Calenge in 2006, designed originally for animal habitat selection. • Adehabitat contains more than a 100 functions giving tools (including ENFA)frequently used in ecology. • Very good graphical output.
Marginality and specialization Marginality (deviation from the global mean) values ranges between 0 to 1. Values close to 1 means that the species have a habitat preference. If specialization (niche breadth) is occurring, any values exceeding (or close to) one indicate some form of specialization.
Today’s exercise • Load adehabitat and ade4 • Download the files • Run ENFA for all the individuals • Run ENFA for each stage • Analyze the outputs
Diststreams contribute the most to the marginality. This plant is found more likely in areas close to streams. DEM and Canopp contribute the most to the specialization.