Download
1 / 15
150 likes | 178 Vues
This article discusses the transition of NSIDC's passive microwave sensor for polar data, including the timeline of satellite transitions, considerations in priority setting, and calibration efforts for F-18. The nearly 40-year record of continuous monitoring will end if current capabilities do not last longer than planned.

E N D
NSIDC’s Passive Microwave Sensor Transition for Polar Data Donna J. Scott NASA NSIDC DAAC Passive Microwave Team with Walt Meier Goddard Space Flight Center
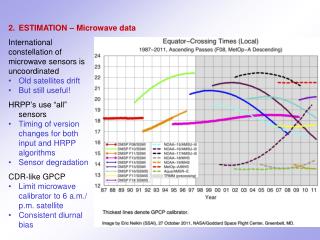
Background – PM sensor record Sensors: Passive microwave sensors provide continuous and near-complete record from 1978-present • F15 - launched 1999 (>16 years old) • F16 - launched 2003 (>12 years old) • F18 - launched 2009 (>6 years old) • AMSR2 - JAXA sensor launched 2012 (Only AMSR2 is operating within its nominal 5 year mission) • F19 launched 2014 (failed February 2016) • F17 launched 2006 (capability for sea ice ended April 2016) • F20 launch was cancelled (in storage) Chinese sensors are in orbit, but access to data is not realistic No other passive microwave sensors are on the horizon until after 2020 → the nearly 40-year record of continuous, consistent monitoring will end if current capabilities do not last significantly longer than planned Additional Impacts include: • Sea ice concentration/extent • Snow extent • Timing of melt onset over snow & ice • Rainfall, total precipitable water, cloud liquid water • Soil moisture • Ocean wind speed Timeline of passive microwave sensors NIMBUS-5 NIMBUS-7 AMSR2 1980 1970 1990 2020 2000 2010 SMMR DMSP F8 F11 F13 F15 F16 Passive Microwave Era F17 NASA EOS AQUA F18 F19 JAXA GCOM-W F20 AMSR-E AMSR3,4
Background – PM Product Team Non-EOS passive microwave data (SMMR-SSM/I-SSMIS) In-house data production LEAD Tech Writer USO OPS Scientist Sci Developer
Timeline of recent satellite transition work • F-17 begins showing bad data • F-18, F-16 parallel processing streams set up • Provisional F-18 data released • Apr 2016 • F-19 NRT parallel processing stream set up • Nov 2015 • F-16 calibration work complete, data running internally • Jun 2016 • NISE F-16 calibrations in work • Aug 2016 • Sept 2016 • Wrap up NRT satellite transition • Look to RSS for F-18 data release for time-series data transition • Jul 2016 • NISE F-18 calibrations complete, data running internally • May 2016 • F-18 calibration completed, data officially released • F-17 fixes made, data running internally • Feb 2016 • F-19 fails prior to calibration • F-18, F-16 discussed as options
Considerations in priority setting • Brightness temperature data vs. sea ice data • Internal NSIDC sea ice data needs • NOAA@NSIDC SII • NASA funded ASINA • 2.5 million views in 2015 • NASA missions needs • Missions use NISE as input. These missions not reporting the impacts in F-17 Remaining considerations • Near-real-time and time-series data no longer consistent with platform sensor • F18 not ready for long time series – RSS does not have F18 online yet. • New approach to provenance and stewardship practices related to NSIDC near-real-time data sets
F-17: What happened? • 4/5/16: Solar panel position change compromised integrity of primary sea ice algorithm channel 16 (37Ghz vertical polarization) • 4/13/16: Solar panel repositioned improving channel 16 problems. Sea ice data at NSIDC still showing problems • 5/25/16: Reports of optimal sensor function after fix to spike detection algorithm. Long term quality unknown and data still at risk • 5/26/16: NSIDC decision to move to F-18 Bad data Bad Data Images April 28, 2016 TBs and Ice Extent
Science • Scott Stewart – NSIDC PM science contractor • Julienne Stroeve – NSIDC • Walt Meier - GSFC NSIDC: An overview
Sea ice product transition • Sea ice concentration derived from brightness temperature using empirical relationships • Coefficients (tiepoints) assigned for pure surface types (water, two ice types) • Intercalibration approach is to adjust tiepoints to match extent/area between sensors during an overlap period • Weather filters, thresholds of TB ratios, used to reduce false ice retrievals over open water • Effectively help define the ice edge NSIDC: An overview
Calibration Effort for F-18 • During the calibration efforts, a provisional F-18 data stream using F-17 tie points was used to enable ASINA to continue reporting sea ice trends • NSIDC investigated the calibration of algorithm tie point values to best match the sea ice extent from F-17 over a 12-month period from 03/01/2015 through 02/29/2016. • Current F-17 tie points provided the best match in sea ice extent, so no adjustment to the tie points were made for F-18. The average difference between F-17- and F18-derived sea ice extents were approximately 20,000 sq km.
F17 to F18 SSMIS sea ice calibration • NSIDC investigators found that brightness temperature values for F18 and F17 were very similar for channels related to sea ice concentration. Brightness temperatures are highly correlated (R = 0.996) Histograms are indistinguishable
F17 to F18 SSMIS sea ice calibration • Attempts to adjust the NASA Team tie points led to worse correlation of extent values, so the values used for F17 continue to be used. • This is likely due to the sensitivity of ice edge to small TB changes, including effects of weather filter thresholds Differences in extent are small (Average daily difference < 10,000 km2)– is this true; looking at the next plot and from the numbers I have the mean difference is ~20k
F16 and F18 extent differences NSIDC: An overview
Science Behind Satellite Transition Issues matching sea ice area and extent • Simply regressing TBs does produce as close of a match is possible • Daily average of swaths • Difference in observation times and number of observations at a location • Cannot optimize both area and extent – i.e., best area match possible will produce an extent difference that is not minimal • Extent is sensitive to weather filters – can potentially adjust thresholds to better match extent without denigrating area differences too much • Seasonal affects also – summer melt season is problematic
Future activities • Goddard will produce a final F18 intercalibration using RSS TBs • There is much potential to improve intercalibration of previous sensor products if/when resources become available • New version of RSS TBs • Longer sensor overlap periods • Use of AMSR-E or AMSR2 as a baseline • Use swath data instead of daily averages? NSIDC: An overview