Download
1 / 22
220 likes | 321 Vues
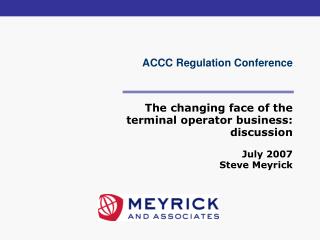
Urban Water Management in Australia The Big Picture Overview ACCC Conference 30 July 2010. Ross Young Executive Director Water Services Association of Australia. Annual and decadal mean temperature anomalies for Australia (compared with 1961-90 average).

E N D
Urban Water Management in Australia The Big Picture OverviewACCC Conference30 July 2010 Ross YoungExecutive Director Water Services Association of Australia
Annual and decadal mean temperature anomalies for Australia (compared with 1961-90 average)
2009 mean temperatures compared against historical temperature records.
(Above) Annual and decadal mean rainfall (mm) for Australia since 1900
Annual inflows to Canberra’s storages 187 GL Long term average inflow 1871 – 2009 68% 56% Gigalitres 48% 45% 35% 32% 32% 28% 68 GL average inflow 2000 - 2009 is 38% of long term average 25% 12%
Annual Inflow to Brisbane's Storages – Wivenhoe, Somerset and North Pine 248% 953 GL Long term average inflow 1889 – 2009 Gigalitres 75% 68% 37% 39% 43% 40% 462 GL average inflow 1997 - 2009 is 49% of long term average 25% 15% 12% 13% 9% 6%
Rainfall Perth Catchment rainfall and runoff Runoff
Desalination in Australia Source: WSAA Report Card 2006-07 and 2007-08
Since 1999-00 the volume of recycled water produced has increased by 130% in major urban water utilities (>50,000 connected properties)
Projected population increases (Series A) for Australia’s major urban water areas up to 2056 Source: ABS 3222.0 Population Projections, Australia, 2006 – 2101, Series A * 2008 observed figures - Planning Information & Forecasting (PIFU) Dept of Infrastructure and Planning SEQ
The changing face of the industry • Water now comes form multiple sources – natural and manufactured; • Water grids being created to minimise risks • SEQ – NSW border to Noosa Heads • Melbourne, Gippsland, Geelong - connected with the Goulburn Valley • Bendigo and Ballarat – connect with the Goulburn Valley; • Water prices increasing • Customers taking responsibility for their own security of supply e.g. rain water tanks, domestic recycling • Move to more decentralised systems – small is beautiful • Integrated water management • Demand for a diversity of water products
Capital Cities' Water Prices as at 1 July 2010 Source: water utility websites
Issues of pricing • Elasticity of demand not known due to water restrictions • State Governments reluctant to introduce different securities of supply • Complaints about the high fixed costs on water bills • Inclining block tariffs vs flat tariffs • Postage pricing – by city and state – will it survive? • What opportunities will smart metering and intelligent networks bring?
Forms of competition • Bulk water provision • CAPEX delivery and OPEX functions • Retail contestability
Competition in the urban water industry • No operating urban markets known by WSAA anywhere in the world • Competition at the wholesale level is possible • Competition at the retail level unlikely • Water bills still a small % of household outgoings • Transaction costs high unless technological break through • Much work required to evaluate marginal social benefits vs marginal social costs – probably through the Productivity Commission Inquiry
Water trading • Rural and urban systems becoming increasingly interconnected • There should be NO policy on rural to urban water trades • Population growth and climate change will result in increased water trading in both rural and urban sectors
Conclusion • Industry has a proud record of reform e.g. 1994 COAG reforms and National Water Initiative • Focus on the integrated urban water cycle – not just drinking water • What about nationally consistent regulation of water? • The needs of customers must drive reform – not ideology • And just in case you have forgotten WATER IS DIFFERENT