Download
1 / 15
170 likes | 472 Vues
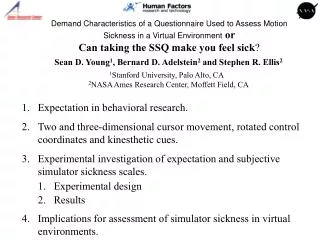
Demand Characteristics of a Questionnaire Used to Assess Motion Sickness in a Virtual Environment or Can taking the SSQ make you feel sick ?. Sean D. Young 1 , Bernard D. Adelstein 2 and Stephen R. Ellis 2 1 Stanford University, Palo Alto, CA 2 NASA Ames Research Center, Moffett Field, CA.

E N D
Demand Characteristics of a Questionnaire Used to Assess Motion Sickness in a Virtual Environmentor Can taking the SSQ make you feel sick? Sean D. Young1, Bernard D. Adelstein2 and Stephen R. Ellis2 1Stanford University, Palo Alto, CA 2NASA Ames Research Center, Moffett Field, CA • Expectation in behavioral research. • Two and three-dimensional cursor movement, rotated control coordinates and kinesthetic cues. • Experimental investigation of expectation and subjective simulator sickness scales. • Experimental design • Results • Implications for assessment of simulator sickness in virtual environments.
Clever Hans (Der kluge Hans): the Horse of Mr. Von Osten Clever Hans Performs for von Osten and Psychologist Stumpf (Berlin ca 1907) Clever Hans with owner Wilhelm von Osten. “Even the dullest college student is aware that some change is expected, particularly if the test is in some obvious way related to the treatment.” (Orne, 1962)
Two dimensional Cursor Movement to Visual Targets on Two dimensional Visual Displays Experimental Task Blocks of 8 Movements 4 3 Motion Start 2 5 1 6 7 5 cm 8 Setup . 65 cm 9cm SRE
-a Torso-referenced Straight-ahead Two Dimensional Cursor Movement Trajectories in Rotated Visual Reference Frames without and with Kinesthetic Cues Oriented Kinesthetic Cueing To Straight-ahead Axis Clockwise Rotation of Control Axes -a° (Ellis, Adelstein & Welch, 2002)
Three dimensional Cursor Movement to Visual Targets in Three dimensional Immersing Visual Displays
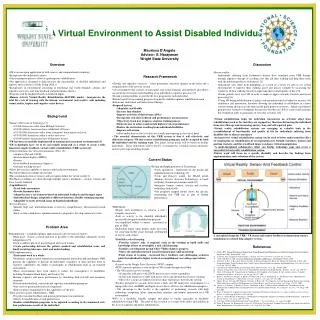
Methods • Two independent randomly assigned groups (16, 14) of 20 men and 10 women, 20-45 yrs old. • Random assignment to Pre-Post/Post-only questionnaire condition • Pre-post questionnaire group- received Simulator Sickness Questionnaire (SSQ) both before and after manipulation (Kennedy, Lane, Berbaum, Lilienthal, 1993) • Post-only questionnaire group- received SSQ questionnaire only after the manipulation • Task: 60 trials of difficult 3D targeting with multiple axis control-display rotation. • ~ 20 X harder than 2D task • ~ 25 minutes on task ,~30 minutes total immersion. • Simulation: WTK, ~800 polygon, Dell Dual Xeon (2.4 GHz), commodity nVidia, Windows 2000. • V8 LCD FOV 48° X 32°, 640 x 480 triades • 60 Hz, 25 msec lag
Scaling factors set standard deviations to 15 for all scales
Computing SSQ Score • To compute the scale scores for each column, the reported value for each symptom is multiplied by the weight in each column and then summed down the columns. • The total SSQ score is obtained by adding the scale scores and multiplying by 3.74. • Weighted scale scores can be individually computed for each column • multiply the ``Nausea'' scale score by 9.54 • multiply the ``Oculomotor'' subscale by 7.58 • multiply the ``Disorientation'' subscale by 13.92.
Results 1. N=14 N=16 N=16 N=14 ±1 SE Variance test F(13,15) = 5.41, p < 0.003 Central tendency tests t(28) = 2.6 p < 0.03 1-tailed, U = 69.5, p < 0.038 Central tendency tests t(28) = 2.6 p < 0.03 1-tailed, U = 69.5, p < 0.038
Results 2. N=16 N=14 N=14 N=16 ±1 SE Central tendency tests t(28) = 2.58 p < 0.03 1-tailed, U = 42, p < 0.01 Central tendency tests t(28) = 2.27 p < 0.03 1-tailed, U = 54, p < 0.03.
Conclusions • Pretesting with SSQ can increase Post-test measurement of simulation/motion sickness with only implicit, low level suggestion. • SSQ can detect low level simulation/motion sickness even in high performance VE. • SSQ type measurements should be compared with subject pool norms to avoid bias from pre-testing. • Selection techniques minimizing suggestion should be used to evaluate simulation sickness during VE immersion.