Download
1 / 7
70 likes | 184 Vues
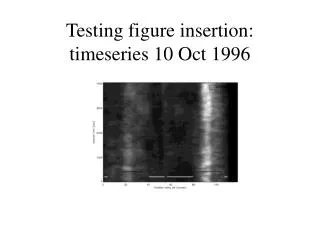
This document explores time series data from October 10, 1996, focusing on MDI, TRACE, and SUMER observations of the photosphere to the solar transition region. It features steep waveforms in the line plots, highlighting MDI velocities in kilometers per second and relative changes in continuum intensities. The plots provide insights into solar dynamics, including velocity variations between approximately -0.5 km/s and +0.5 km/s. Each plot is presented separately and can be converted or accessed through various formats, enabling detailed analysis of solar behavior.

E N D
Steep waveforms - not exactly shock plots - from Phil Time series, for MDI, TRACE, and SUMER data from the photosphere to the solar transition region. The line plots show MDI velocities (in kilometers per second) and the relative changes in the continuum intensities $I/\langle I\rangle - 1$. In these plots, the horizontal grid lines mark zero ± one (for example, the MDI data vary between roughly -0.5 and +0.5 km/s for the leftmost panel).
Ps pdf: open with Acrobat Distillerif that doesn’t work, convert within GVpdf jpg: “save as” jpg in Acrobatedit jpg in PAINTpdf jpg: convert in Acrobat