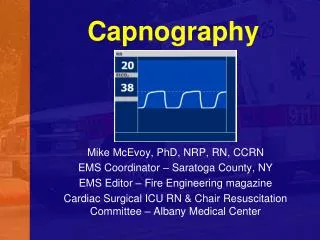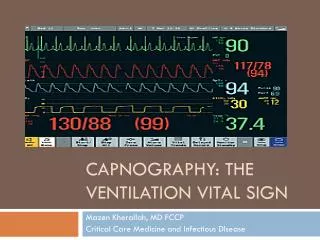
Capnography
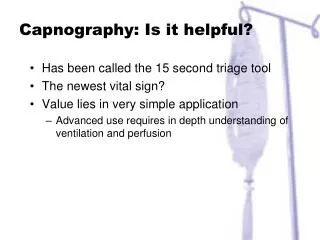
Capnography. Principles and Clinical Application. Objectives. Describe the advantages of mainstream vs. sidestream CO 2 technology. Discuss normal and abnormal V/Q relationships. Identify a normal capnogram and discuss phase I thru IV.

Capnography
E N D
Presentation Transcript
Capnography Principles and Clinical Application
Objectives • Describe the advantages of mainstream vs. sidestream CO2 technology. • Discuss normal and abnormal V/Q relationships. • Identify a normal capnogram and discuss phase I thru IV. • Discuss the ETCO2/PaCO2 gradient and its clinical application. • Interpret abnormal capnograms and their clinical intervention. . .
Capnography - Technology • Capnographs utilize infrared (IR) technology • CO2 molecules absorb IR light energy of a specific wavelength • Amount of energy absorbed = CO2 concentration • Infrared is particularly appropriate for measuring CO2 • CO2 has a strong absorption band in the infrared spectrum • In the ICU, the CO2 band is distinct enough from other gases to minimize interference
Capnography vs. Capnometry Capnography – Technology • Capnography • Measurement & display of ETCO2 and the CO2 capnogram • Measured by a capnograph • Capnometry • Measurement & display of the ETCO2 value • Measured by a capnometer
Quantitative vs. Qualitative ETCO2 Capnography • Qualitative ETCO2 • Only provides range of values • Termed CO2 detectors - Easy Cap • Quantitative ETCO2 • Provides actual numeric value • Found in capnographs and capnometers
Capnography Mainstream vs. Sidestream
Capnography - Mainstream • Sensor placed in ventilator circuit • Measurement made at the patient’s airway • IR sensor can not be contaminated by patient secretions! • Fast response time • No water traps or tubing needed - hassle free Sensor
Sample measured inside monitor CO2 sample Acquired here Capnography – Sidestream • Sensor located away from the airway • IR sensor can be contaminated by patient secretions!! • Measurement made by pump inside the monitor • Slower response time • Water traps and tubing required troubleshooting and maintenance
Capnography Solid State vs. Chopper Wheel • Solid State CO2 Sensors • No moving parts = durability • Uses a beam splitter to measure IR light at two wavelengths • IR light source electronically pulsed • Chopper Wheel CO2 Sensors • Spinning wheel = very fragile • Spins to change parameter measured by photodetector • Gas sample to be measured (data) • Sample plus sealed gas reference cell • No light at all
Capnography What Are We Measuring?
1 Cellular Metabolism of food into energy - O2 consumption & CO2 Production 2 Transport of O2 & CO2 between cells and pulmonary capillaries 3 Ventilation between alveoli and pulmonary capillaries Capnography Respiration - The Big Picture
Capnography Depicts Respiration Metabolism Transport CO2 CO2 O2 CO2 Capnography Ventilation
Arterial CO2 (PaCO2) from ABG ETCO2 from Capnograph Capnography Normal Arterial & ETCO2 Values Normal PaCO2 Values: Normal ETCO2 Values: 35 - 45 mmHg 30 - 43 mmHg
Arterial - End Tidal CO2 Gradient Capnography In healthy lungs the normal PaCO2 to ETCO2 gradient is 2-5 mmHg In diseased lungs, the gradient will increase due to ventilation/perfusion mismatch
CO2 O2 Normal Ventilation and perfusion is matched Deadspace Ventilation Alveoli ventilated but not perfused Shunt perfusion Alveoli perfused but not ventilated Ventilation- Perfusion Relationships Ventilation-Perfusion Relationships Relationship between ventilated alveoli and blood flow in the pulmonary capillaries
CO2 O2 . . Normal V/Q ETCO2 / PaCO2 Gradient = 2 to 4 mmHg
. . Shunt Perfusion – Low V/Q ETCO2 / PaCO2 Gradient = 4 to 10 mmHg No exchange of O2 or CO2
. . Shunt Perfusion – Low V/Q • Disease processes that may cause Shunt Perfusion: • Mucus plugging • ET tube in right or left main stem bronchus • Atelectasis • Pneumonia • Pulmonary edema • In short anything that causes the alveoli to collapse or is alveolar filling
Dead Space Ventilation . . High V/Q ETCO2 / PaCO2 Gradient is large Ventilation is not the problem! Perfusion is the problem No exchange of O2 or CO2occurs
Dead Space • Why is understanding Alveolar Dead Space important? • As Alveolar Dead Space increases, the gradient between ETCO2 and PaCO2 increases • Why does increased Alveolar Dead Space create a gradient?
53 53 0 53 0 0 0 0 0 0 Dead Space Ventilation ETCO2 = 33 mmHg PaCO2 = 53 mmHg Alveoli that do not take part in gas exchange will still have no CO2 – Therefore they will dilute the CO2 from the alveoli that were perfused The result is a widened ETCO2 to PaCO2 Gradient
A Gradient is a Good Thing • Why? • Lets clinicians know when patient status improves • PaCO2/ETCO2 gradient narrows • Aids in determining what caused a drop in ETCO2 • If ventilation hasn’t changed a sudden and large drop in ETCO2 usually indicates a change in perfusion.
Dead Space Ventilation • Disease processes that may cause Dead Space Ventilation: • Pulmonary embolism • Hypovolemia • Cardiac arrest • Shock • In short anything that causes a significant drop in pulmonary blood flow
Capnography Clinical Application of Capnography
Capnography • Clinical utility of the CO2 Waveform or capnogram • Provides validation of ETCO2 value • Visual assessment of patient airway integrity • Verification of proper ET tube placement • Assessment of ventilator, and breathing circuit integrity
50 25 0 Beginning of expiration = anatomical deadspace with no measurable CO2 Normal Capnogram - Phase I CO2 mmHg B A
Anatomical Dead Space Anatomical Deadspace Conducting Airway - No Gas Exchange • Anatomical Dead Space • Internal volume of the upper airways • Nose • Pharynx • Trachea • Bronchi
50 25 0 Normal Capnogram - Phase II CO2 mmHg C B Mixed CO2, rapid rise in CO2 concentration
50 Alveolar Plateau, all exhaled gas took part in gas exchange 25 End Tidal CO2 value 0 Normal Capnogram - Phase III CO2 mmHg D C Time
50 25 0 Normal Capnogram - Phase IV Inspiration starts, CO2 drops off rapidly CO2 mmHg D E
Alveolar Plateau established No Alveolar Plateau Capnogram – Valuable Tool CO2 (mmHg) 50 25 0
Abnormal CO2 Waveforms
Capnography Endotracheal Tube in Esophagus • Possible Causes: • Missed Intubation • A normal capnogram is the best evidence that the ET tube correctly positioned. • When the ET tube is in the esophagus, little or no CO2 is present
Capnography Obstruction in Airway or Breathing Circuit • Possible Causes: • Partially kinked or narrowed artificial airway • Presence of foreign body in the airway • Obstruction in expiratory limb of breathing circuit • Bronchospasm
Capnography Muscle Relaxants (curare cleft) • Possible Causes: • Patient attempts to take a breath • Appear when muscle relaxants begin to subside • Depth of cleft is inversely proportional to degree of drug activity
Capnography Cardiac Oscillations • Characteristics: • Rhythmic and synchronized to heart rate
Capnography Inadequate Seal Around ET Tube • Possible Causes: • Leaky or uncuffed endotracheal or trach tube • Artificial airway that is too small for patient
Capnography Hypoventilation - Increase in ETCO2 • Possible Causes: • Decrease in respiratory rate • Decrease in tidal volume • Increase in metabolic rate • Rapid rise in body temperature
Capnography Hyperventilation - Decrease in ETCO2 • Possible Causes: • Increase in respiratory rate • Increase in tidal volume • Decrease in metabolic rate • Fall in body temperature
Capnography Rebreathing • Possible Causes: • Expiatory filter that is saturated or clogged, expiratory valve that is sticking • Inadequate inspiratory flow, or insufficient expiratory time • Anything that causes resistance to expired flow
Case Study • A 29 year old male with head injury, and a compound fracture of his femur sustained in a motorcycle accident • 2 weeks post trauma on mechanical ventilation with the following philological values: PaCO2 – 42 mmHg PaO2 – 95 mmHg ETCO2 – 38 mmHg Total Rate – 14 bpm Minute Ventilation – 7 L/Min
Case Study Normal capnogram, stable trend ETCO2/PaCO2 gradient 4 mmHg
Case Study Sudden decrease in ETCO2 from 38 mmHg to 20 mmHg and remains there RR – increases to 24 bpm Minute Volume increases to 12 Lpm
Case Study ABG was drawn with the following results: PaCO2 38 mmHg PaO2 59 mmHgPaCO2/ETCO2 gradient18 mmHg
Case Study • Ventilation /perfusion lung scan was consistent with a pulmonary embolism • A sudden drop in ETCO2 • Associated with a large increase in the PaCO2/ETCO2 gradient • Often is associated with pulmonary embolism
Summary • Capnography affords the clinician breath by breath trending of ETCO2 and thus a non- invasive look at ventilation • Provides an objective reason for ABG’s • Trend ETCO2/PaCO2 gradient to observe patient improvement • Changes in ventilation and perfusion are are often observed by trending the gradient