CAPNOGRAPHY and PULSE OXIMETRY
420 likes | 1.62k Vues
CAPNOGRAPHY and PULSE OXIMETRY. CAPNOGRAPHIC DEVICES. Infrared Absorption Photometry Colorimetric Devices Mass Spectrometry Raman Scattering. INFRARED . First developed in 1859. Based on Beer-Lambert law: Pa = 1 - e - DC Pa is fraction of light absorbed is absorption coefficient

CAPNOGRAPHY and PULSE OXIMETRY
E N D
Presentation Transcript
CAPNOGRAPHIC DEVICES • Infrared Absorption Photometry • Colorimetric Devices • Mass Spectrometry • Raman Scattering
INFRARED • First developed in 1859. • Based on Beer-Lambert law: Pa = 1 - e- DC • Pa is fraction of light absorbed • is absorption coefficient • D is distance light travelsthough the gas • C is molar gas concentration • The higher the CO2 concentration, the higher the absorption. • CO2 absorption takes place at 4.25 µm • N2O, H2O, and CO can also absorb at this wavelength • Two types: side port and mainstream
SIDE PORT • Gas is sampled through a small tube • Analysis is performed in a separate chamber • Very reliable • Time delay of 1-60 seconds • Less accurate at higher respiratory rates • Prone to plugging by water and secretions • Ambient air leaks
MAINSTREAM • Sensor is located in the airway • Response time as little as 40msec • Very accurate • Difficult to calibrate without disconnecting (makes it hard to detect rebreathing) • More prone to the reading being affected by moisture • Larger, can kink the tube. • Adds dead space to the airway • Bigger chance of being damaged by mishandling
COLORIMETRIC • Contains a pH sensitive dye which undergoes a color change in the presence of CO2 • The dye is usually metacresol purple and it changes to yellow in the presence of CO2 • Portable and lightweight. • Low false positive rate • Higher false negative rate • Acidic solutions, e.g., epi, atropine, lidocaine, will permanently change the color • Dead space relatively high for neonates, so don’t use for long periods of time on those patients.
NORMAL CAPNOGRAM • Phase I is the beginning of exhalation • Phase I represents most of the anatomical dead space • Phase II is where the alveolar gas begins to mix with the dead space gas and the CO2 begins to rapidly rise • The anatomic dead space can be calculated using Phase I and II • Alveolar dead space can be calculated on the basis of : VD = VDanat + VDalv • Significant increase in the alveolar dead space signifies V/Q mismatch
NORMAL CAPNOGRAM • Phase III corresponds to the elimination of CO2 from the alveoli • Phase III usually has a slight increase in the slope as “slow” alveoli empty • The “slow” alveoli have a lower V/Q ratio and therefore have higher CO2 concentrations • In addition, diffusion of CO2 into the alveoli is greater during expiration. More pronounced in infants • ET CO2 is measured at the maximal point of Phase III. • Phase IV is the inspirational phase
Increased Phase III slope Obstructive lung disease Phase III dip Spontaneous resp Horizontal Phase III with large ET-art CO2 change Pulmonary embolism cardiac output Hypovolemia Sudden in ETCO2 to 0 Dislodged tube Vent malfunction ET obstruction Sudden in ETCO2 Partial obstruction Air leak Exponential Severe hyperventilation Cardiopulmonary event ABNORMALITIES
Gradual Hyperventilation Decreasing temp Gradual in volume Sudden increase in ETCO2 Sodium bicarb administration Release of limb tourniquet Gradual increase Fever Hypoventilation Increased baseline Rebreathing Exhausted CO2 absorber ABNORMALITIES
PaCO2-PetCO2 gradient • Usually <6mm Hg • PetCO2 is usually less • Difference depends on the number of underperfused alveoli • Tend to mirror each other if the slope of Phase III is horizontal or has a minimal slope • Decreased cardiac output will increase the gradient • The gradient can be negative when healthy lungs are ventilated with high TV and low rate • Decreased FRC also gives a negative gradient by increasing the number of slow alveoli
LIMITATIONS • Critically ill patients often have rapidly changing dead space and V/Q mismatch • Higher rates and smaller TV can increase the amount of dead space ventilation • High mean airway pressures and PEEP restrict alveolar perfusion, leading to falsely decreased readings • Low cardiac output will decrease the reading
USES • Metabolic • Assess energy expenditure • Cardiovascular • Monitor trend in cardiac output • Can use as an indirect Fick method, but actual numbers are hard to quantify • Measure of effectiveness in CPR • Diagnosis of pulmonary embolism: measure gradient
PULMONARY USES • Effectiveness of therapy in bronchospasm • Monitor PaCO2-PetCO2 gradient • Worsening indicated by rising Phase III without plateau • Find optimal PEEP by following the gradient. Should be lowest at optimal PEEP. • Can predict successful extubation. • Dead space ratio to tidal volume ratio of >0.6 predicts failure. Normal is 0.33-0.45 • Limited usefulness in weaning the vent when patient is unstable from cardiovascular or pulmonary standpoint • Confirm ET tube placement
CAPNOGRAM #1 J Int Care Med, 12(1): 18-32, 1997
CAPNOGRAM #2 J Int Care Med, 12(1): 18-32, 1997
CAPNOGRAM #3 J Int Care Med, 12(1): 18-32, 1997
CAPNOGRAM #4 J Int Care Med, 12(1): 18-32, 1997
CAPNOGRAM #5 J Int Care Med, 12(1): 18-32, 1997
CAPNOGRAM #6 J Int Care Med, 12(1): 18-32, 1997
CAPNOGRAM #7 J Int Care Med, 12(1): 18-32, 1997
CAPNOGRAM #8 J Int Care Med, 12(1): 18-32, 1997
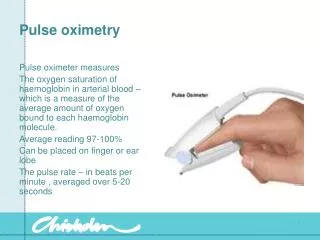
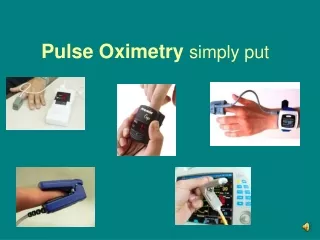
PULSE OXIMETRY • Uses spectrophotometry based on the Beer-Lambert law • Differentiates oxy- from deoxyhemoglobin by the differences in absorption at 660nm and 940nm • Minimizes tissue interference by separating out the pulsatile signal • Estimates heart rate by measuring cyclic changes in light transmission • Measures 4 types of hemoglobin: deoxy, oxy, carboxy, and met • Estimates functional hemoglobin saturation: oxyhemoglobin/deoxy + oxy
SOURCES OF ERROR • Sensitive to motion • Standard deviation is certified to 4% down to 70% saturation • Sats below 85% increase the importance of error in the reading • Calibration is performed by company on normal patients breathing various gas mixtures, so calibration is certain only down to 80%
SOURCES OF ERROR • Skin Pigmentation • Darker color may make the reading more variable due to optical shunting. • Dark nail polish has same effect: blue, black, and green polishes underestimate saturations, while red and purple have no effect • Hyperbilirubinemia has no effect • Low perfusion state • Ambient Light • Delay in reading of about 12 seconds
SOURCES OF ERROR • Methylene blue and indigo carmine underestimate the saturation • Dysfunctional hemoglobin • Carboxyhgb leads to overestimation of sats because it absorbs at 660nm with an absorption coefficient nearly identical to oxyhgb • Methgb can mask the true saturation by absorbing too much light at both 660nm and 940nm. Saturations are overestimated, but drop no further than 85%, which occurs when methgb reaches 35%.
SOURCES OF ERROR • Affect of anemia is debated • Oxygen-Hemoglobin Dissociation Curve • Shifts in the curve can affect the reading • Oximetry reading of 95% could correspond to a PaO2 of 60mmHg (91% saturation) or 160mmHg (99% saturation)